
Geopolitical conflict, market stress, and the emerging role of crypto as a macro asset, an analysis of the Iran crisis.
When U.S.-Israeli airstrikes hit Iran on February 28, 2026, the world’s financial markets did what they always do during geopolitical shocks: they panicked. Oil surged 13%. Equities dropped. Gold spiked. And Bitcoin, the asset that still divides opinion between “digital gold” and “leveraged tech stock”, did something interesting.
It crashed 4.5%, triggered $490 million in liquidations, and then recovered within 48 hours while institutions poured $458 million into spot ETFs in a single day.
This lite preview is not a news recap. It is a macro-crypto analysis of what actually happened across asset classes, what it reveals about Bitcoin’s evolving identity, and what it means for investors positioning through geopolitical uncertainty.

The Geopolitical Trigger
On the night of February 28, the United States and Israel launched coordinated strikes on Iran, targeting IRGC headquarters, missile facilities, naval bases, and nuclear infrastructure across Tehran, Isfahan, Qom, Karaj, and Kermanshah. Iran’s Supreme Leader Ayatollah Ali Khamenei was killed in the operation.
Iran retaliated within hours, striking U.S. military bases across the Middle East. President Trump projected the conflict would last 4–5 weeks. Vessels began steering clear of the Strait of Hormuz, a 21-mile-wide chokepoint through which roughly 20 million barrels of oil flow daily, representing approximately 20% of global petroleum liquids and over 25% of seaborne crude trade. More than 80% of this oil is bound for Asian markets: China, India, Japan, and South Korea.
Market Reaction Across Asset Classes
The strikes triggered a textbook flight-to-safety rotation, but with important nuances that reveal how 2026’s market structure differs from previous crises.
Oil led the reaction. Brent crude surged from ~$72.50 to $82.44, a 13% move driven by immediate Strait of Hormuz disruption fears. Barclays warned oil could hit $100 if the Strait were fully blocked. Analysts estimated a geopolitical risk premium of $4–10 per barrel had been embedded into prices within hours.
Equities sold off sharply at the open, Dow futures dropped 543 points (1.1%), S&P 500 futures fell 1.1%, Nasdaq 1.6%, before partially recovering intraday. Defense stocks (Lockheed Martin +6%, Northrop Grumman +5%) outperformed. By March 3, the S&P 500 had drifted -0.9%, entering negative territory for the year.
Gold initially surged 5.2% to $5,392 per ounce, a classic safe-haven move. But then it reversed, falling back to ~$5,049 by March 3 as the dollar strengthened on inflation expectations. Key insight: gold’s safe-haven premium was short-lived because the same oil shock that triggered it also strengthened the dollar through rate expectations.
Treasuries, and this is where it gets unusual, also sold off. The 10-year yield rose 8 basis points to 4.044%; the 2-year rose 10 basis points to 3.479%. In a typical geopolitical crisis, Treasuries rally as investors seek safety. This time, inflation fears from the oil shock outweighed safe-haven demand. The bond market was pricing stagflation, not recession.
Bitcoin dropped from ~$67,000 to $63,038, a 4.5% decline, within minutes of the first strike reports. Ethereum fell harder, dropping ~10% to $1,836. The total crypto market cap temporarily shed $128 billion.
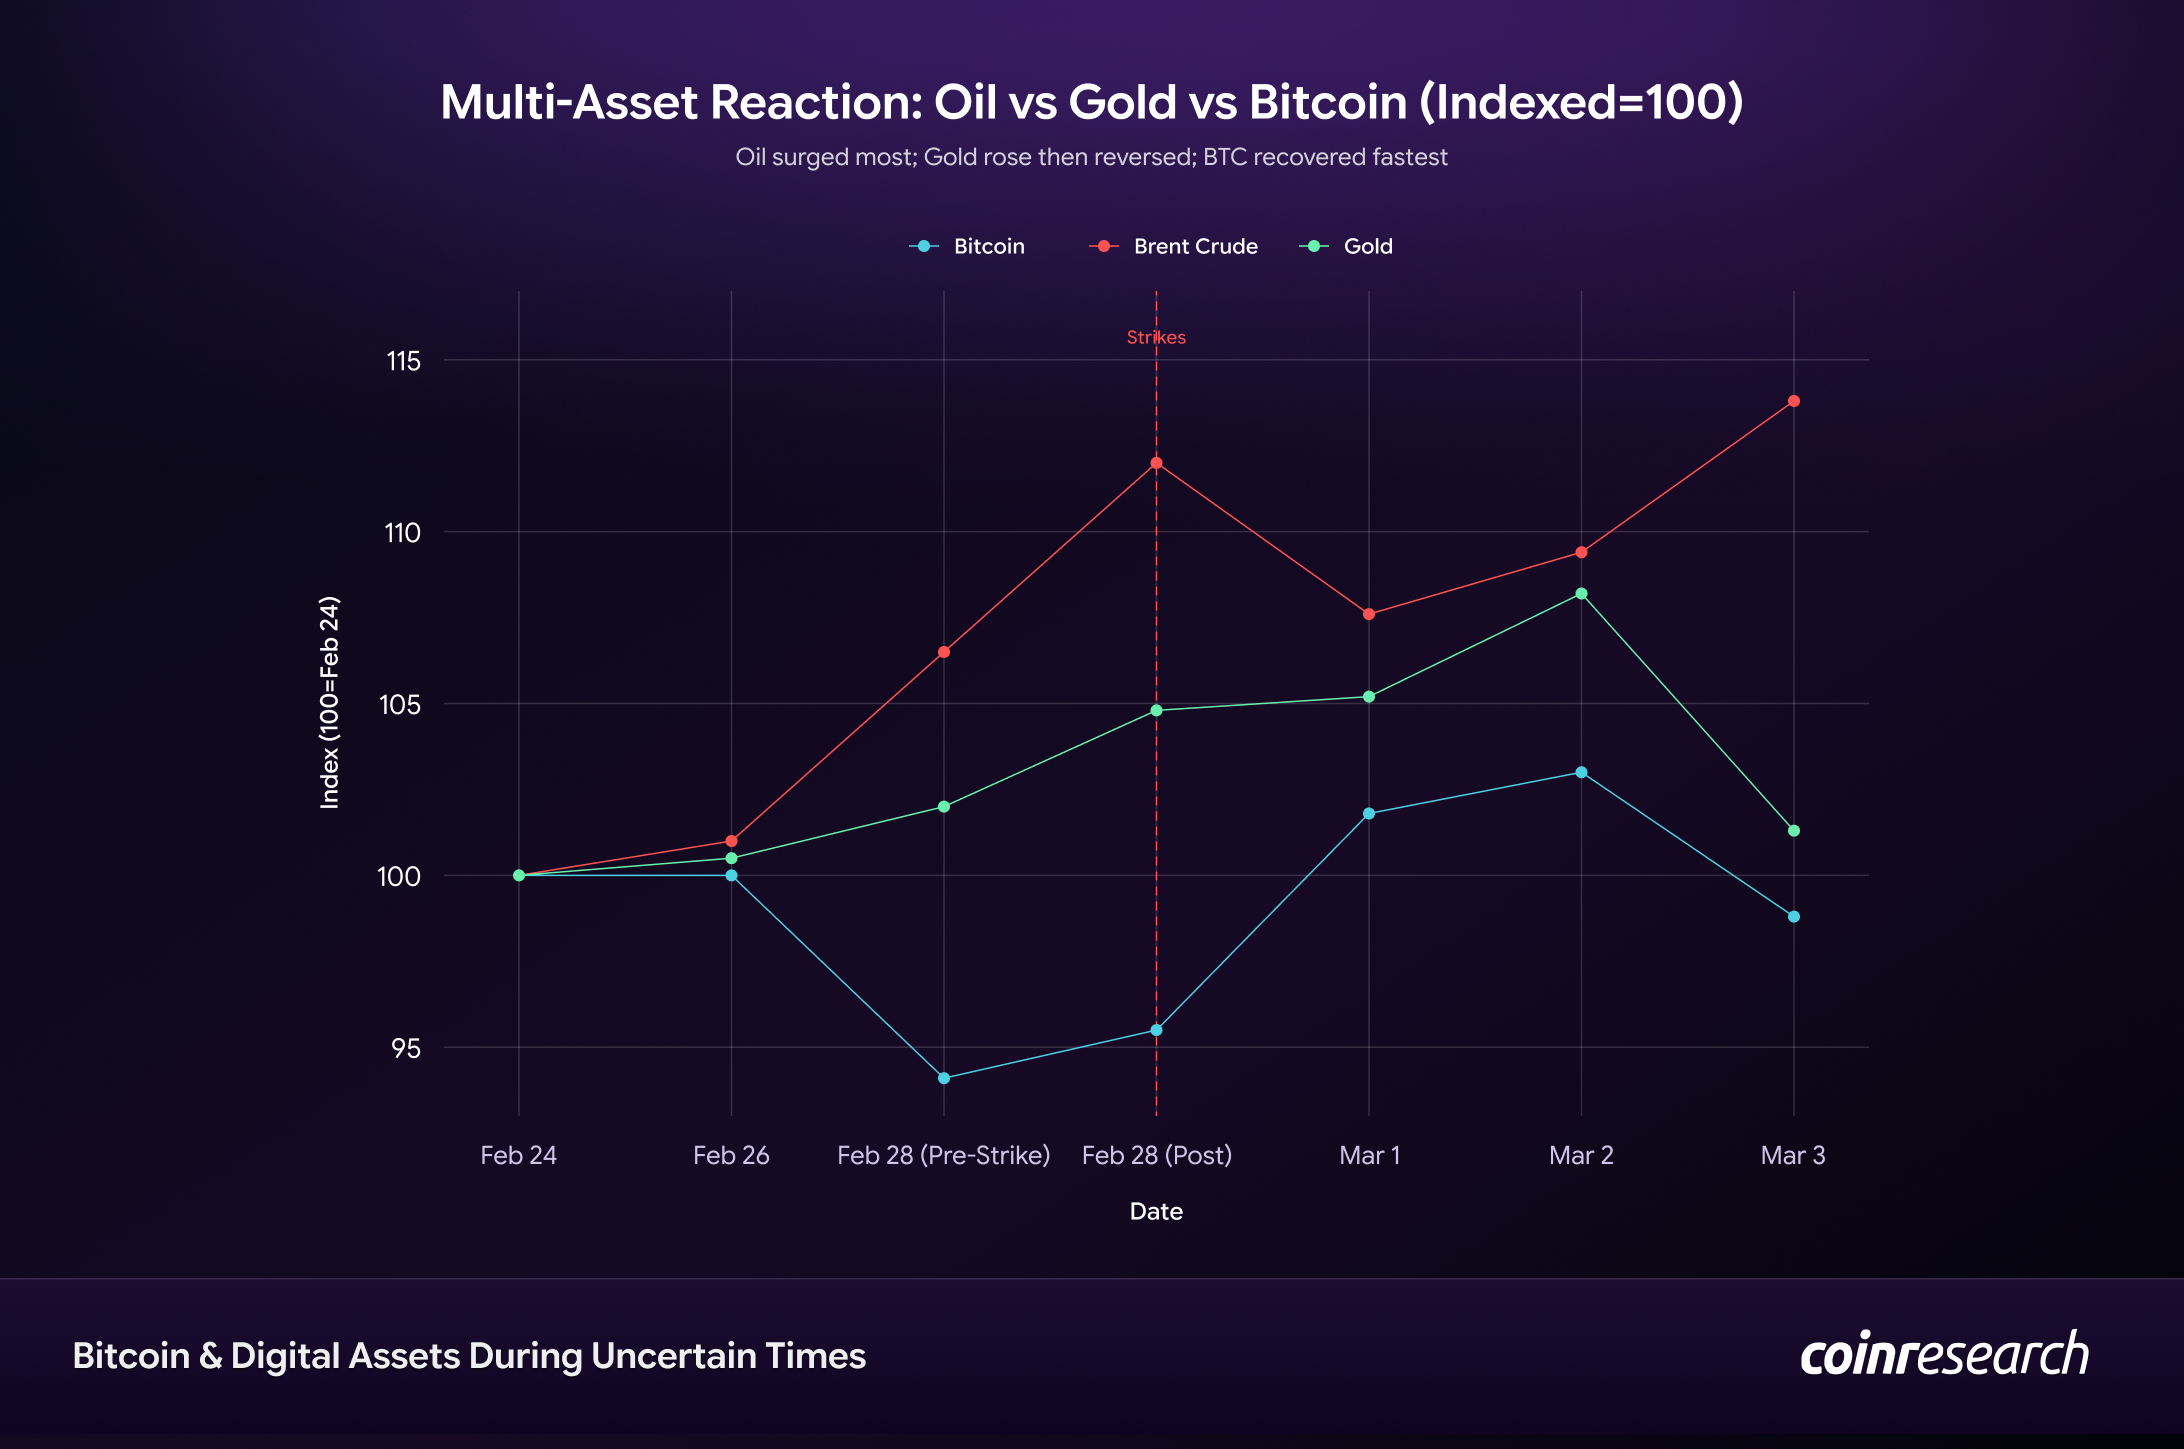
Oil surged most on supply shock; BTC recovered fastest post-shock; gold reversed on dollar strength.
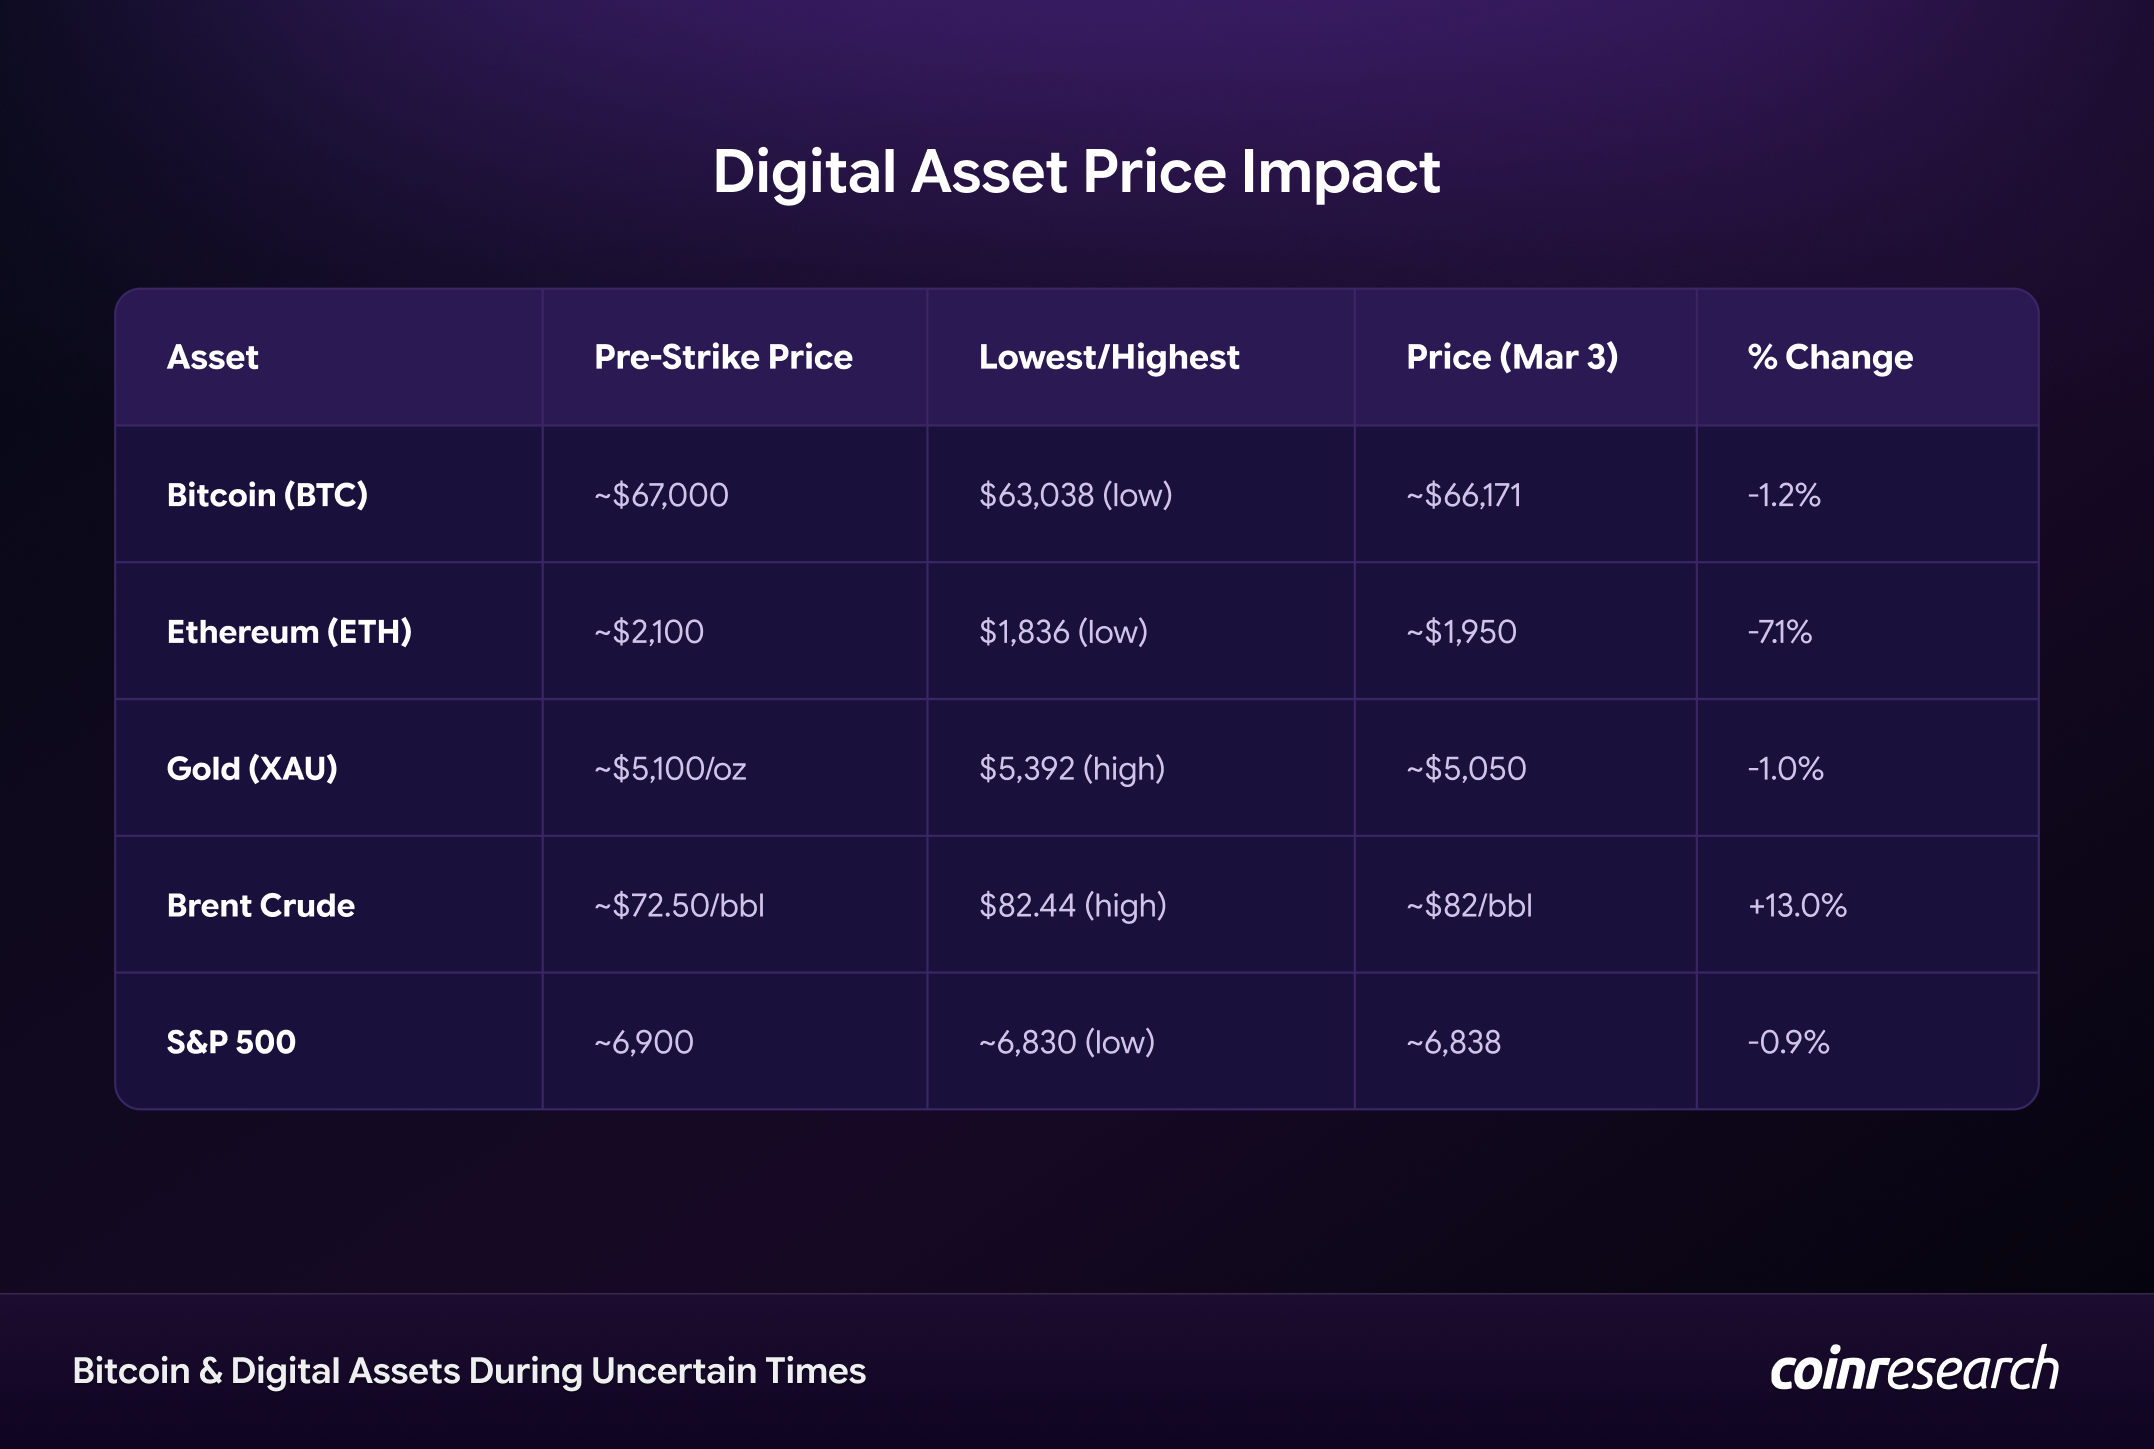
BTC -1% net, ETH -7%, oil +13%, equities flat. Crypto showed relative resilience vs traditional risk assets.
Bitcoin’s Stress Test
The Iran crisis gave Bitcoin its most significant real-time stress test since the Russia-Ukraine war of 2022. The results reveal a market that is structurally different from even two years ago.
The crash was fast but contained. $100 million in leveraged long positions were liquidated within 15 minutes of the first headlines. Within an hour, that number hit $137 million. By 24 hours, total liquidations reached $490 million, with BTC accounting for $196 million and ETH $132 million.
Yet context matters: QCP Capital described this as a “contained selloff” compared to the $2.1 billion liquidation event in early February 2026. The market’s leverage was already lower entering this crisis.
The recovery was institutional. On March 2, spot Bitcoin ETFs recorded $458.2 million in single-day inflows, the largest in weeks. BlackRock’s IBIT led with $263.2 million. Zero funds reported outflows that day. This reversed a five-week streak of ETF outflows totaling $6.39 billion and marked the first positive weekly flow ($787 million) since late January.
The signal was clear: while retail and leveraged traders panic-sold, institutions bought the dip. This is a structural shift in how Bitcoin absorbs geopolitical shocks.
Crypto as the First Market to React
There is a structural reason Bitcoin moves first during geopolitical events: it never closes.
While equity markets were shut for the weekend when Iran retaliated, Bitcoin was already repricing. Crypto’s 24/7 trading means it functions as a real-time barometer for global risk sentiment, absorbing news, fear, and capital flows before traditional markets open on Monday morning.
This creates a paradox. Bitcoin’s volatility during weekend crises is not a weakness, it is a feature. It provides continuous price discovery when every other major market is dark.
However, the same structure that makes crypto first to react also makes it first to overshoot. Perpetual futures markets with 20–100x leverage create liquidation cascades that amplify price moves far beyond what spot demand alone would produce. The $490 million in liquidations on February 28 is a direct consequence of this leverage architecture.
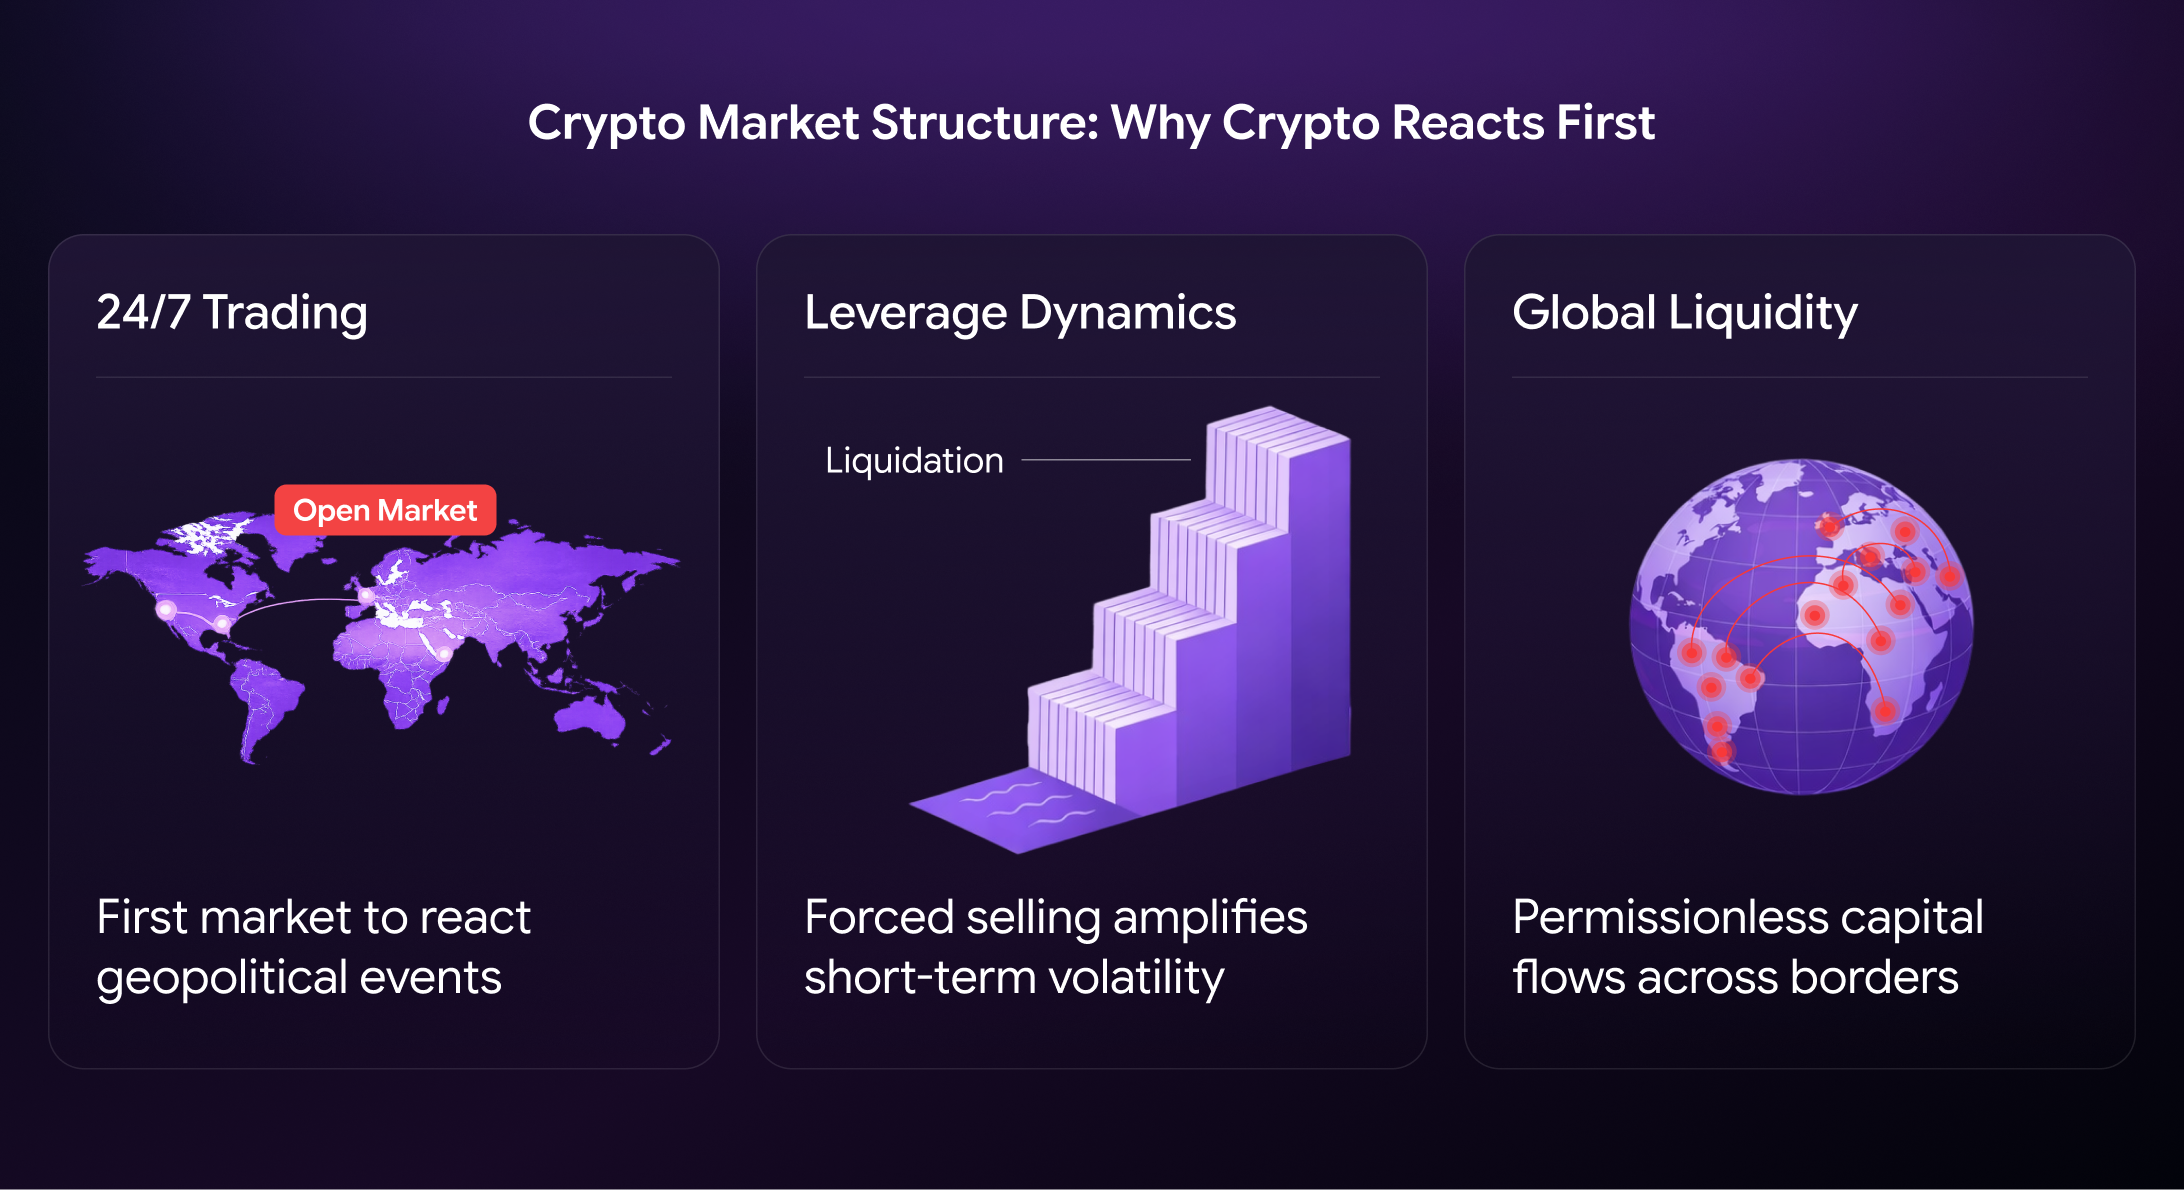
24/7 trading prices geopolitical news instantly; leverage cascades amplify shocks; global liquidity enables borderless capital flight.
Real-World Crypto Usage During Conflict
The most underreported story of the Iran crisis was not the Bitcoin price. It was the $10.3 million that left Iranian crypto exchanges between February 28 and March 2.
Nobitex, Iran’s largest crypto exchange with 11 million users, saw a 700% surge in withdrawal volumes. Hourly outflows peaked at $2.8 million between 11:00–12:00 GMT on Saturday, March 1. Blockchain analytics firms Chainalysis and Elliptic identified three categories of outflows:
-
Citizen self-custody, ordinary Iranians moving assets to personal wallets ahead of potential exchange shutdowns or banking disruptions.
-
Exchange fund cycling, platforms repositioning liquidity to overseas exchanges.
-
State-aligned actors, entities moving funds preemptively, potentially for sanctions circumvention.
Iran’s total crypto ecosystem is estimated at $7.8 billion. The $10.3 million outflow represents a small fraction, but the velocity, not the volume, is the signal. When airstrikes begin, crypto moves in minutes. Bank transfers do not.
This is the use case that separates Bitcoin from gold during wartime. You cannot carry gold bars across a border checkpoint. You cannot wire dollars from a sanctioned bank. But you can memorize 12 words and carry a Bitcoin wallet in your head.
Bitcoin vs. Traditional Safe Havens
The Iran crisis exposed a fundamental question: is Bitcoin a risk asset, a safe haven, or something else entirely?
The honest answer is that Bitcoin behaves as a hybrid asset, and this crisis proved it.
In the first 60 minutes post-strike, Bitcoin traded like a risk asset. It sold off alongside equities, driven by leveraged liquidations and algorithmic selling. Gold, by contrast, rallied immediately.
But in the 48 hours that followed, Bitcoin decoupled. While gold reversed on dollar strength, while Treasuries sold off on inflation fears, and while equities continued drifting lower, Bitcoin stabilized and began recovering, supported by institutional ETF inflows.
Historical Comparison: Bitcoin During Past Crises
The most important chart in this report shows Bitcoin’s drawdown shrinking across successive geopolitical crises:
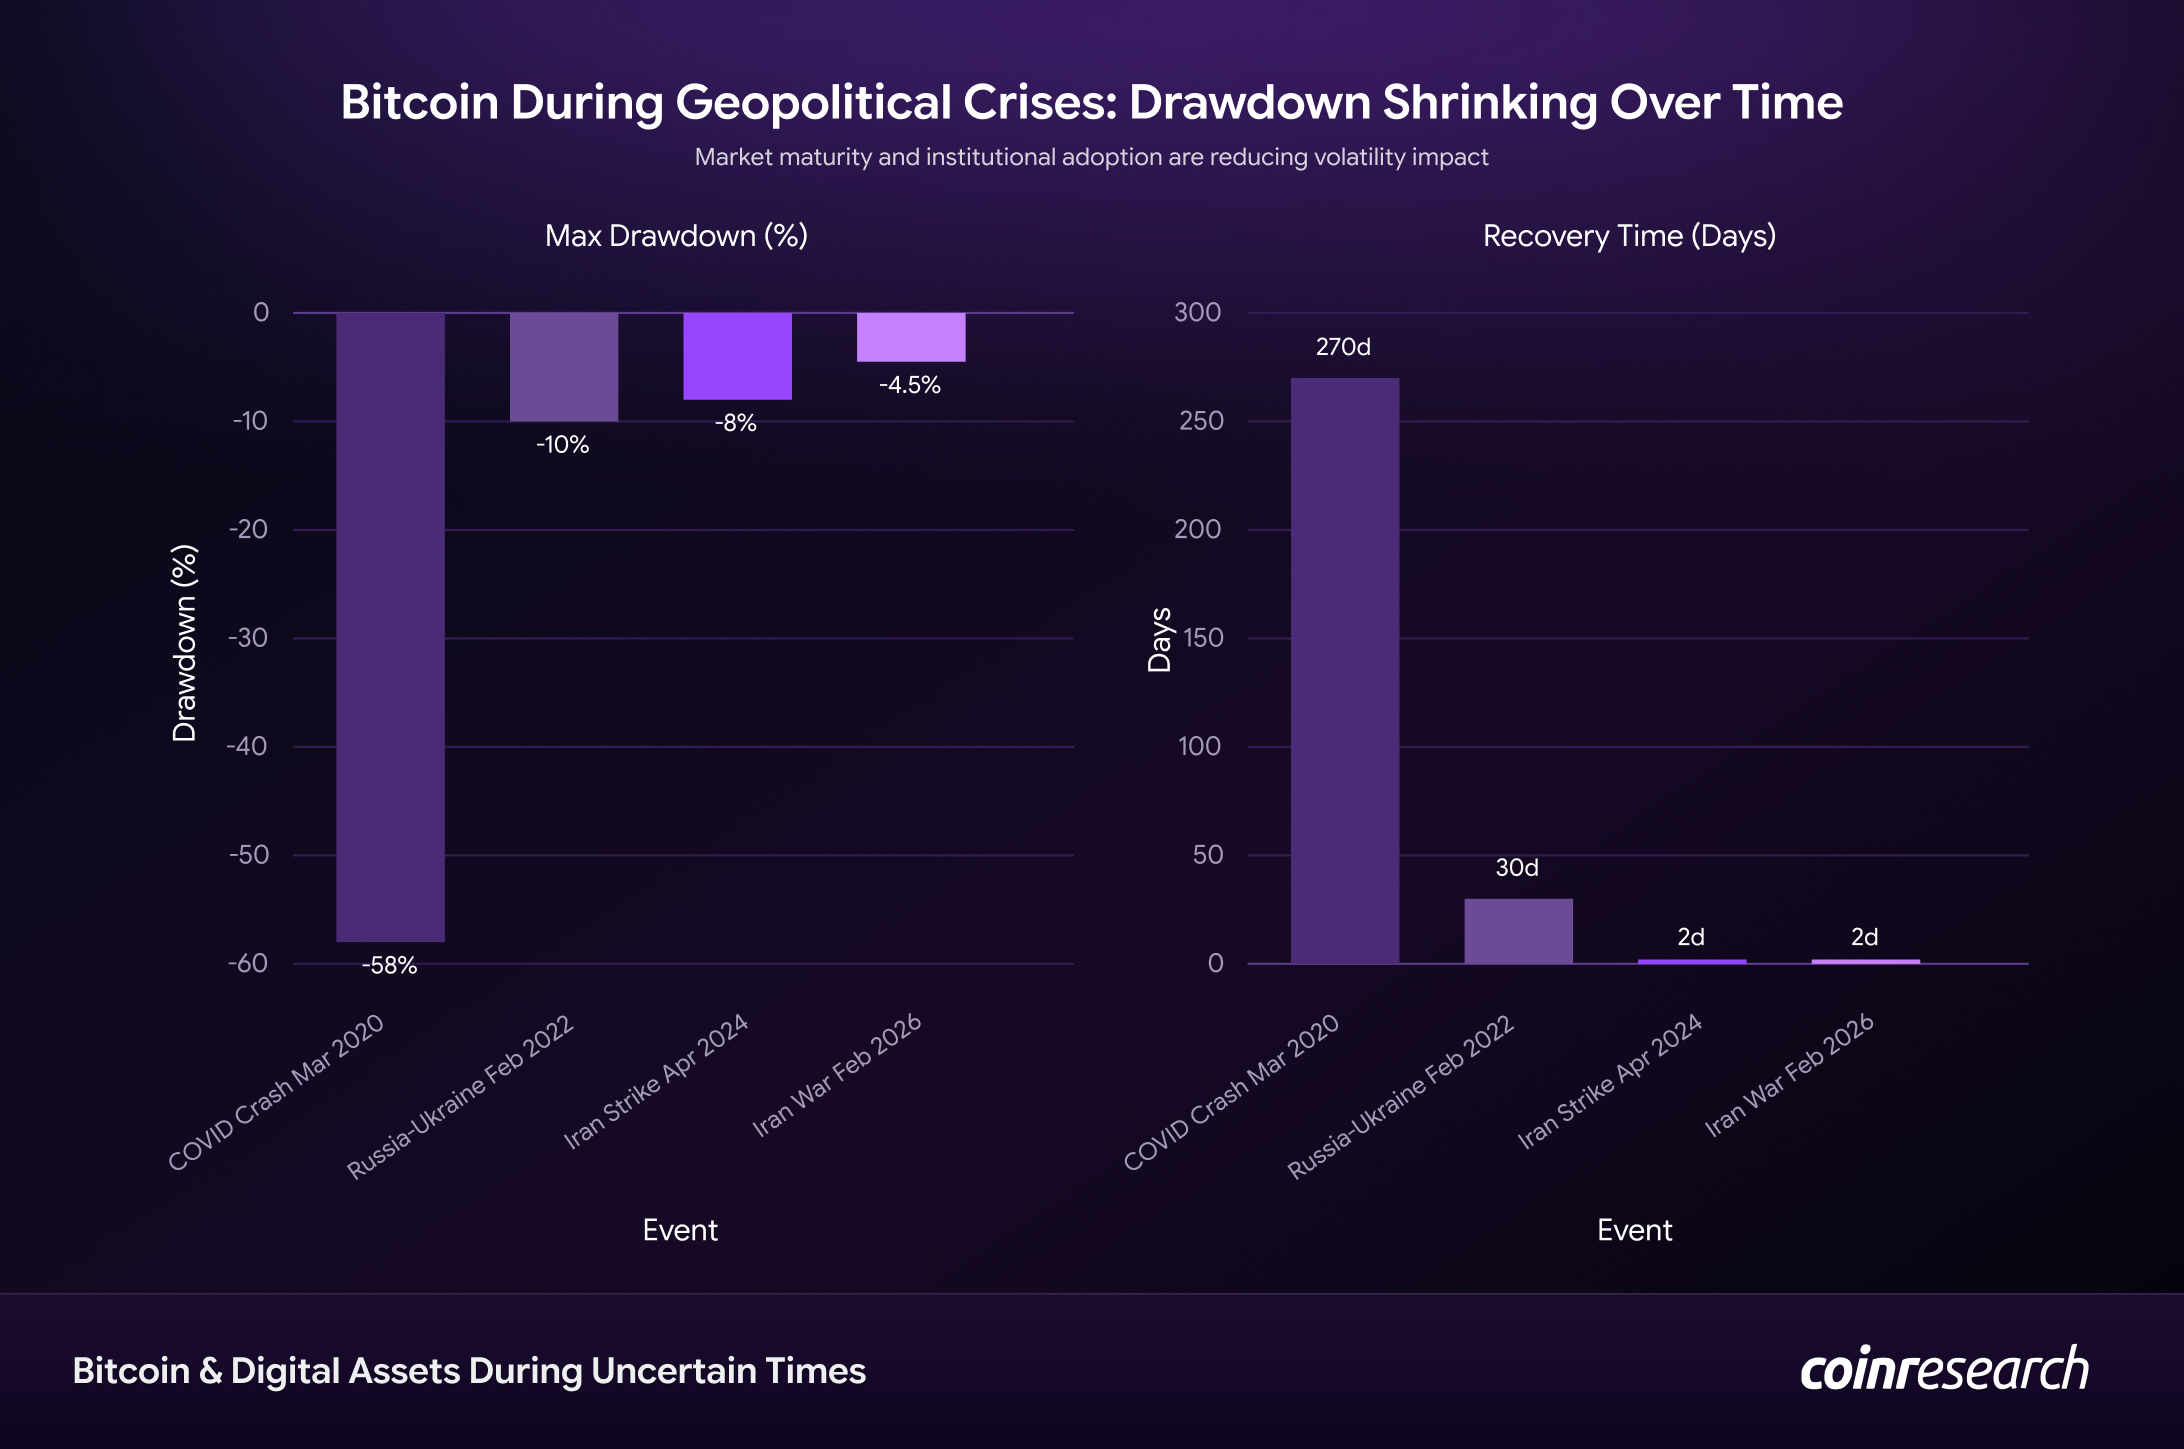
Max decline: COVID -58% → Iran 2026 -4.5%. Recovery: 270 days → 2 days. Market maturity + institutional flows reducing volatility impact.
Pattern: Each crisis produces smaller drawdown + faster recovery. This reflects structural maturation, not diminishing risks.
🔒 Want the Full In-depth Report?
This is the lite preview. The premium CoinResearch AI report includes:
– 4x Detailed Scenarios (Hormuz closure → BTC $45k vs war printing → $100k+)
– Portfolio Construction (optimal BTC sizing, oil hedges, entry triggers)
– Scenario Probabilities (quantified with market-implied odds)
– Trade Framework (exact entry/exit rules for this regime)
Unlock in-depth research reports & analytics like this for $9/mo
Forward-Looking Outlook
BTC transitions from speculative risk → structural macro portfolio component:
-
Institutional floor: $458M ETF inflow = buyer of last resort
-
Shrinking drawdowns: -58% → -4.5% proves maturation
-
Real utility: $10.3M Iranian flight = wartime value transfer proven
Actionable framework:
-
Core: 5–10% BTC (”digital gold 2.0”)
-
Hedge: Monitor oil/Hormuz as primary transmission
-
Avoid: Excess leverage (spot survives, perps don’t)
-
Signal: Weekly ETF flows = institutional conviction gauge
Bitcoin survives crises. The question is whether it graduates to “safe haven that holds.” Iran moved that needle forward.
This report is for informational purposes only and does not constitute investment advice. All investments carry risk, including the potential loss of principal. Past performance of any asset class, sector, or security does not guarantee future results. The scenarios, projections, and price targets discussed are based on publicly available data and analyst estimates as of March 6, 2026, and are subject to change. Readers should conduct their own due diligence and consult a qualified financial advisor before making investment decisions.