
Our predictive model & analytics called UP nine days in a row starting at $67K. Here’s what it saw before the ceasefire, the short squeeze, and the breakout.
Everyone was looking at oil. We were looking at the data.
For 60 consecutive days heading into April, the Crypto Fear & Greed Index sat below 10 — a record that more than doubled the Terra/Luna streak. Bitcoin was trapped between $62,500 and $75,000. The consensus was bearish stagnation.
The narrative was simple: oil above $100 means inflation stays hot, the Fed stays on hold, and risk assets go nowhere. The market had priced in a prolonged grind.
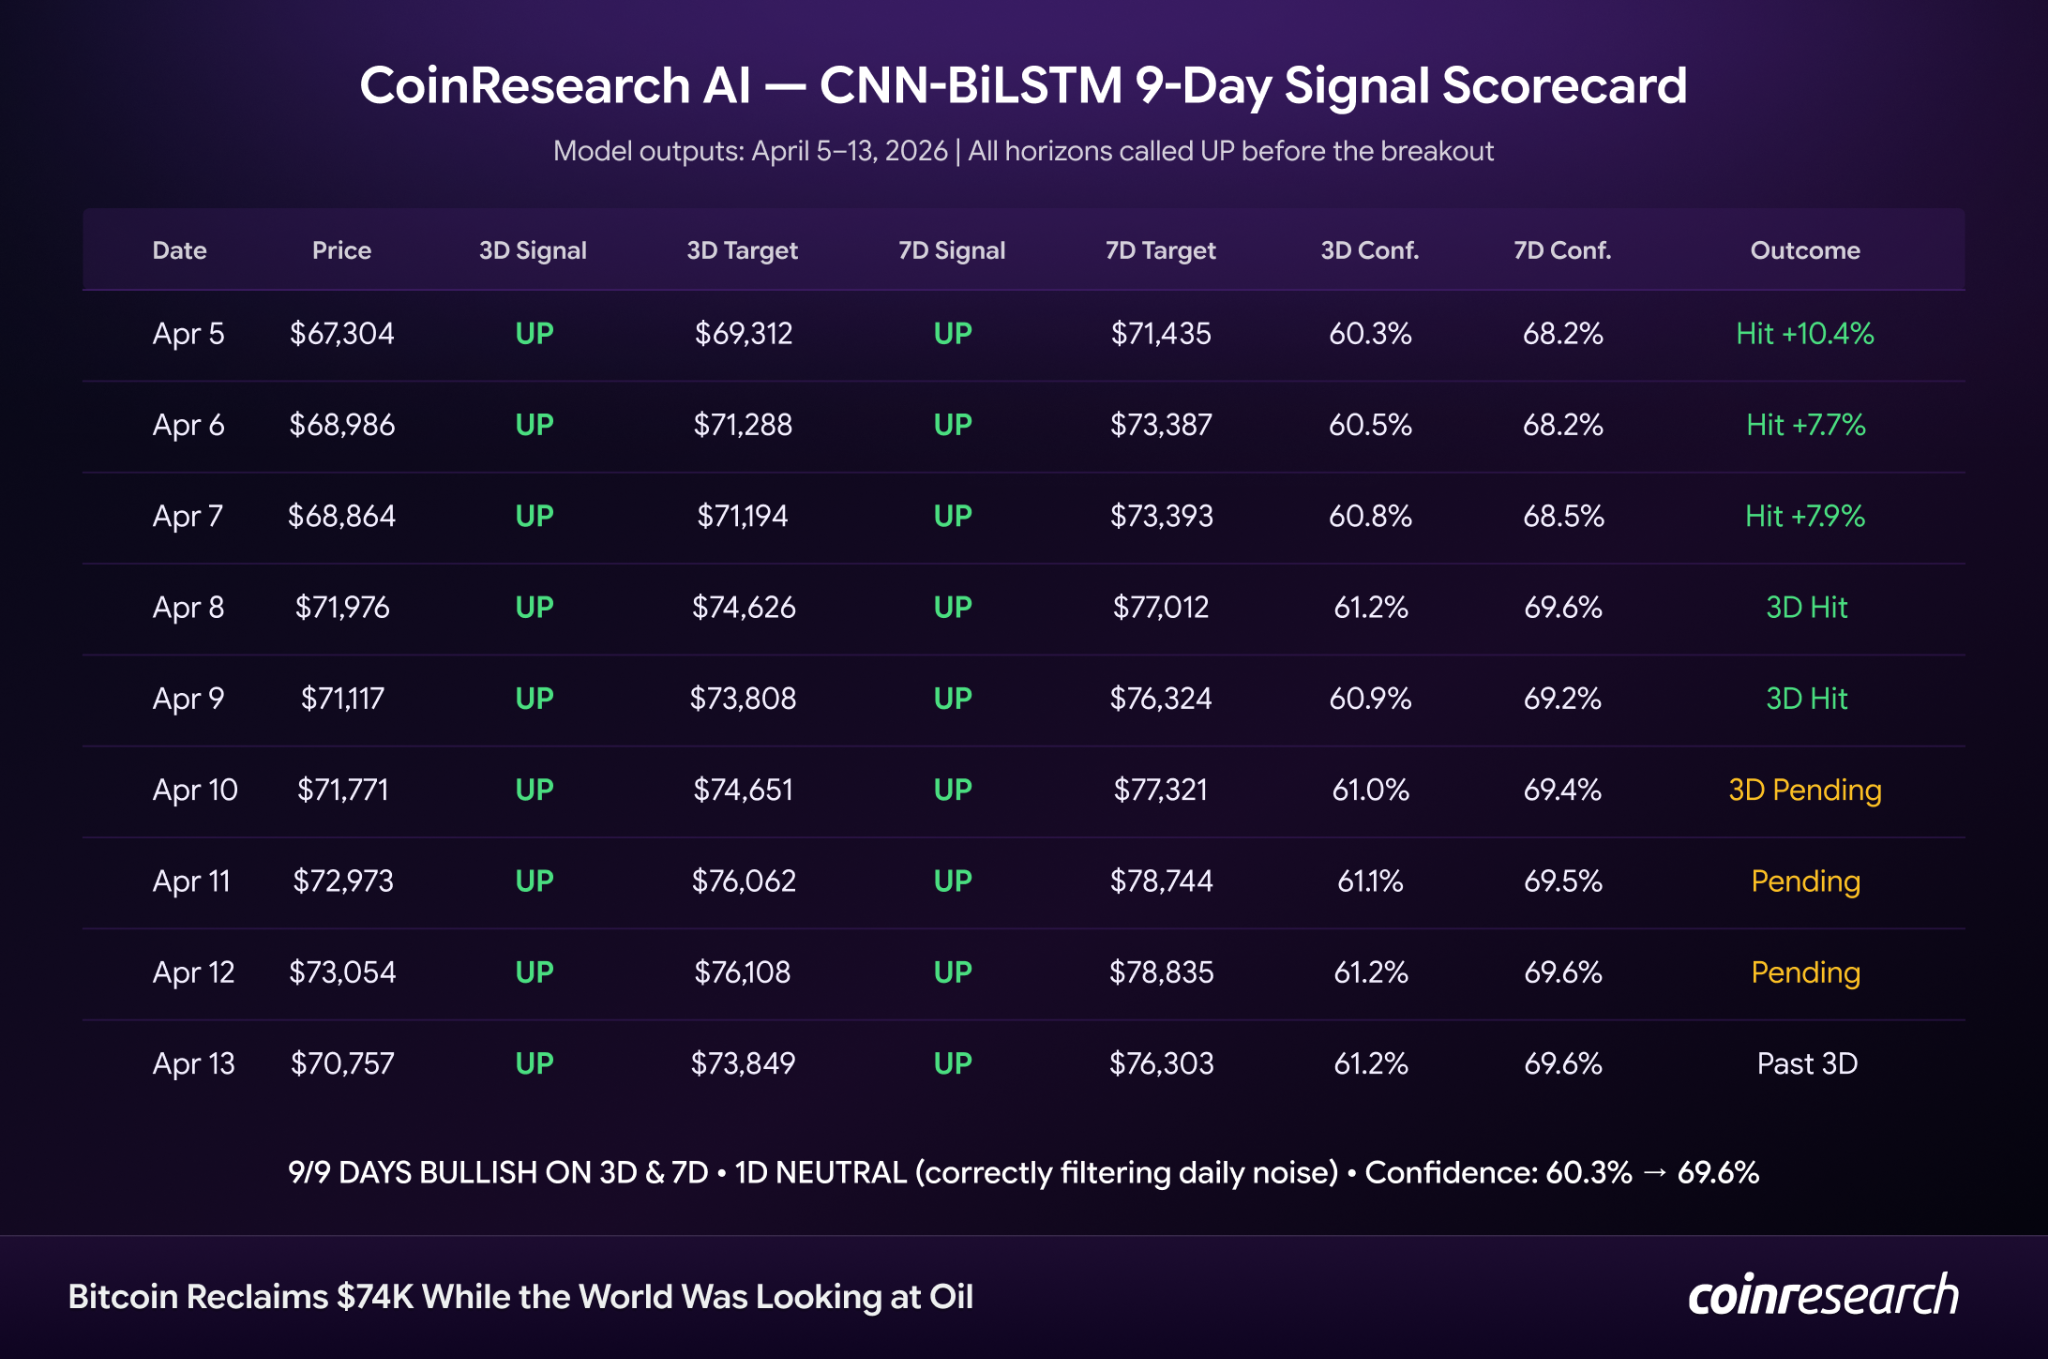
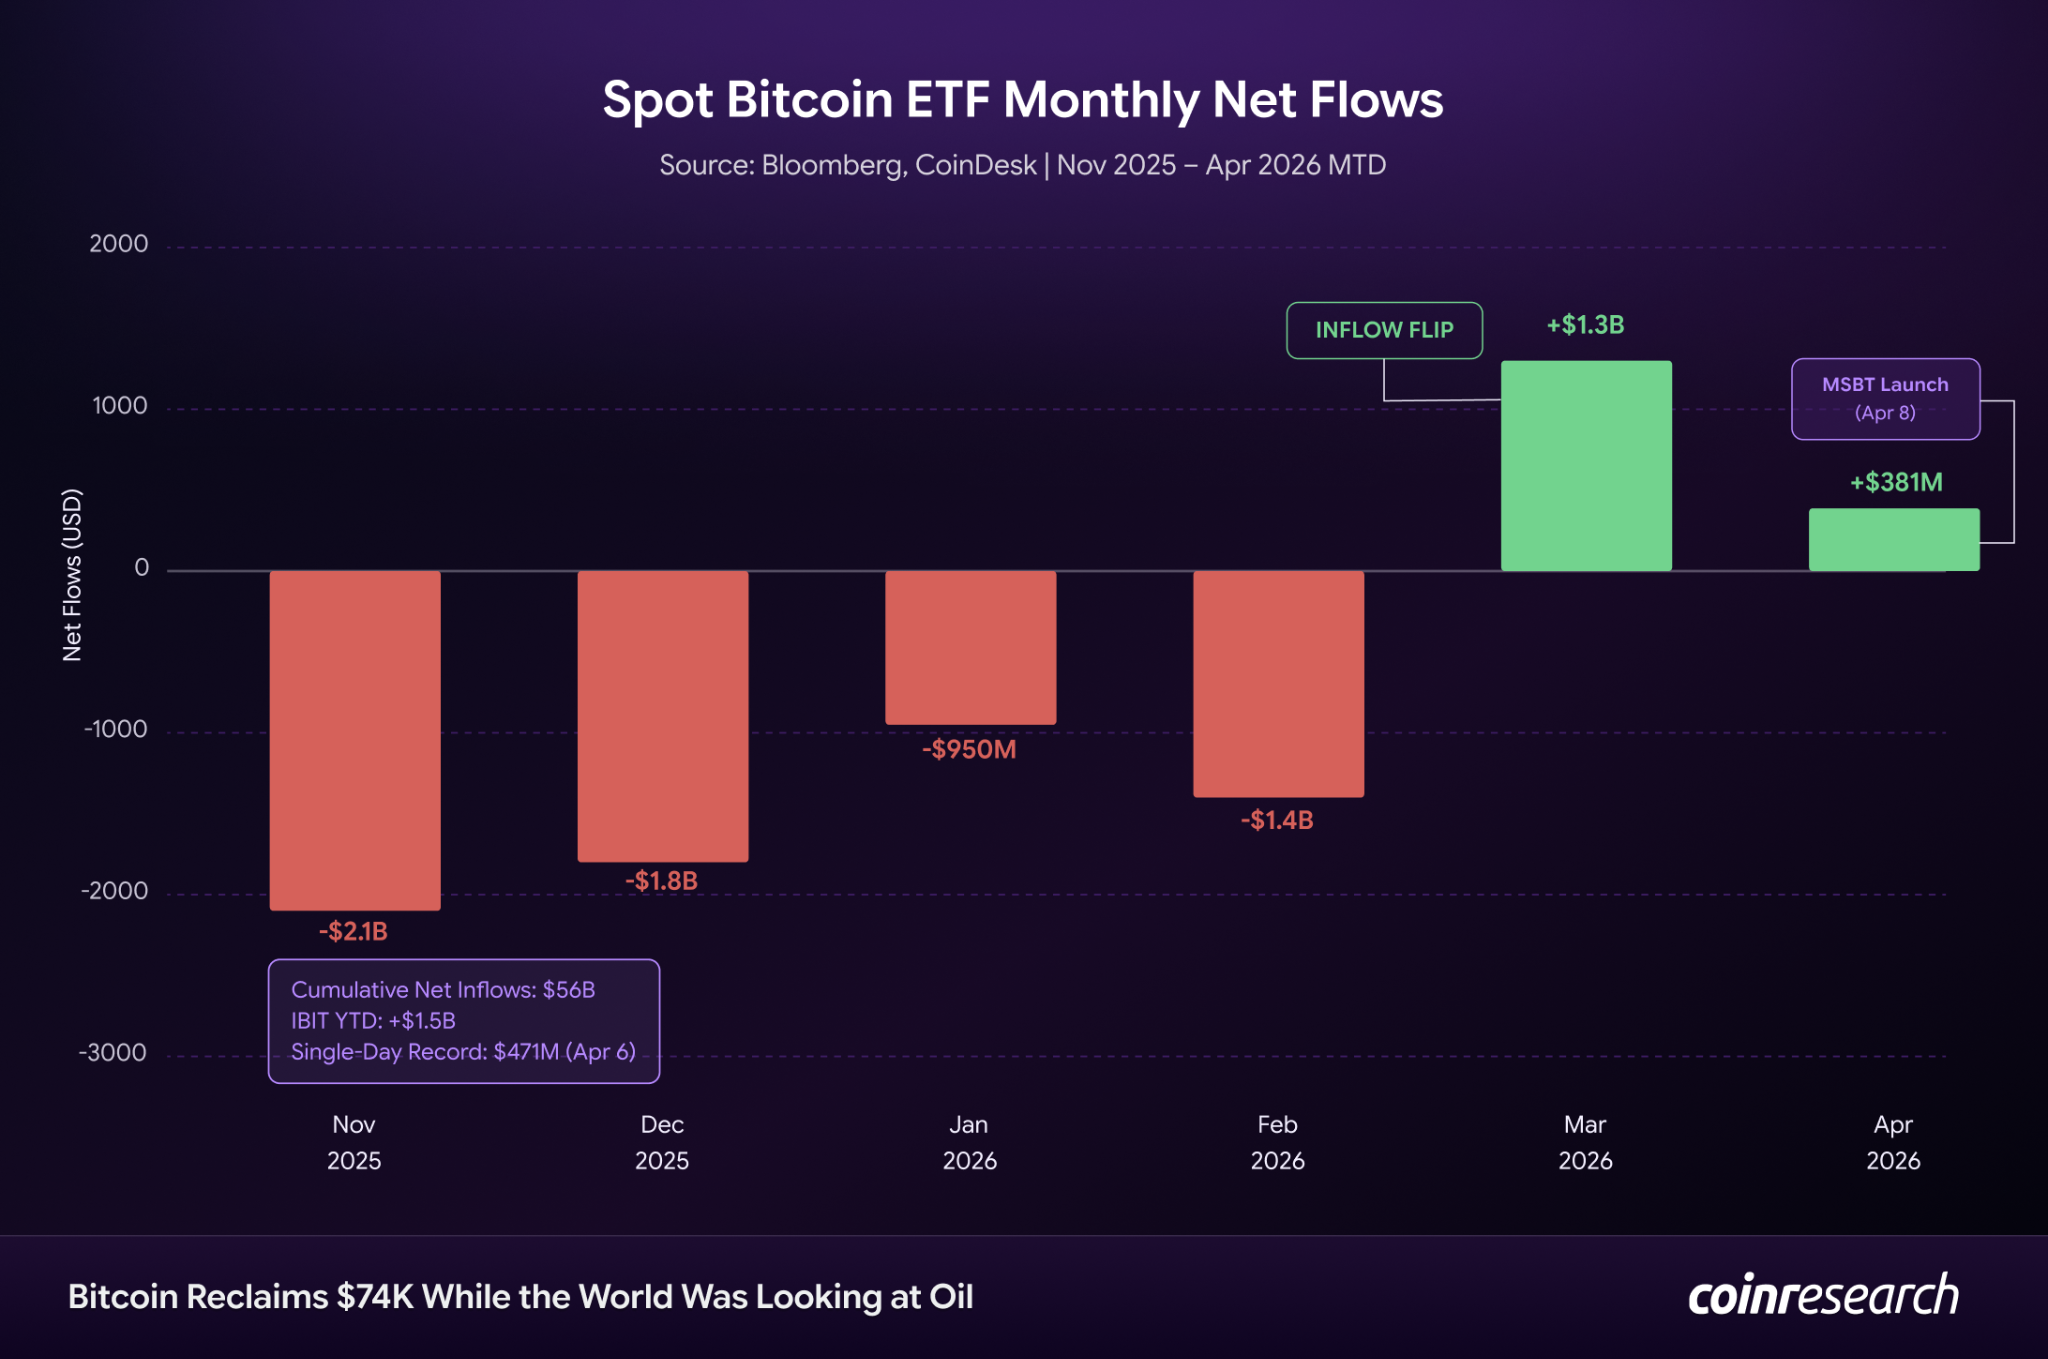
But underneath, something was building. Spot Bitcoin ETFs quietly flipped to net positive inflows in March after four consecutive months of outflows. Strategy was buying aggressively. And our CNN-BiLSTM predictive model started calling UP — on April 5, at $67,304. Then again on April 6. And April 7. Nine days in a row.
Five days later, Bitcoin hit $74,900.
What Actually Happened
Bitcoin moved from $67,304 on April 5 to an intraday high of $74,900 on April 13 — an 11.3% run in nine days. The move compressed into two phases: a steady grind from $67K to $72K between April 5–8, then a sharp acceleration on April 8 when BTC jumped $3,000 in a single session.
The Hormuz blockade over the weekend (April 12) briefly pulled price back to $70,741 before buyers defended the level and ran it to $74,900 on Monday afternoon.
Bitcoin’s market cap added roughly $140 billion in nine days. Ethereum, Solana, and XRP all gained 6–8% alongside.
The Model Didn’t Hesitate
CoinResearch AI’s CNN-BiLSTM model issued UP signals on both 3D and 7D horizons every single day from April 5 through April 13. Zero hesitation.
The 1D horizon stayed NEUTRAL — correctly identifying daily price action as noisy and inconclusive. The multi-day signal was the one that mattered, and it never wavered. Confidence climbed from 60.3% to 69.6% on the 7D horizon over the streak.
The April 5 prediction at $67,304 called for $71,435 on 7D. BTC hit $74,332 — a 10.4% move.
The model called the direction before the ceasefire, before the short squeeze, and before Morgan Stanley’s MSBT launch. That’s the difference between reading headlines and reading structure.
Catalyst #1: The Ceasefire Shock
On the evening of April 7, Trump announced a two-week U.S.-Iran ceasefire via Truth Social. Iran confirmed safe passage through the Strait of Hormuz — the chokepoint for roughly 20% of global oil consumption.
Oil crashed 16% in a single session. WTI dropped from $112 to $95 per barrel — the sharpest single-day decline since the pandemic era.
Bitcoin jumped from $68,800 to $72,700 overnight. The transmission was mechanical: oil down → inflation expectations recalibrate → risk appetite returns → capital flows back to high-beta assets.
Catalyst #2: The $600M Short Squeeze
The ceasefire didn’t just spark buying — it detonated weeks of crowded short positioning. Funding rates had turned negative during the conflict, meaning shorts were paying longs to maintain their positions. Consensus was bearish stagnation.
When BTC broke $70,000, those positions unwound violently. Approximately $600 million in leveraged futures liquidated in 24 hours — $427 million from shorts alone. The liquidation cascade was self-reinforcing: shorts closed → buying pressure → price up → more shorts liquidated.
The ceasefire was the match. The short squeeze was the gasoline.
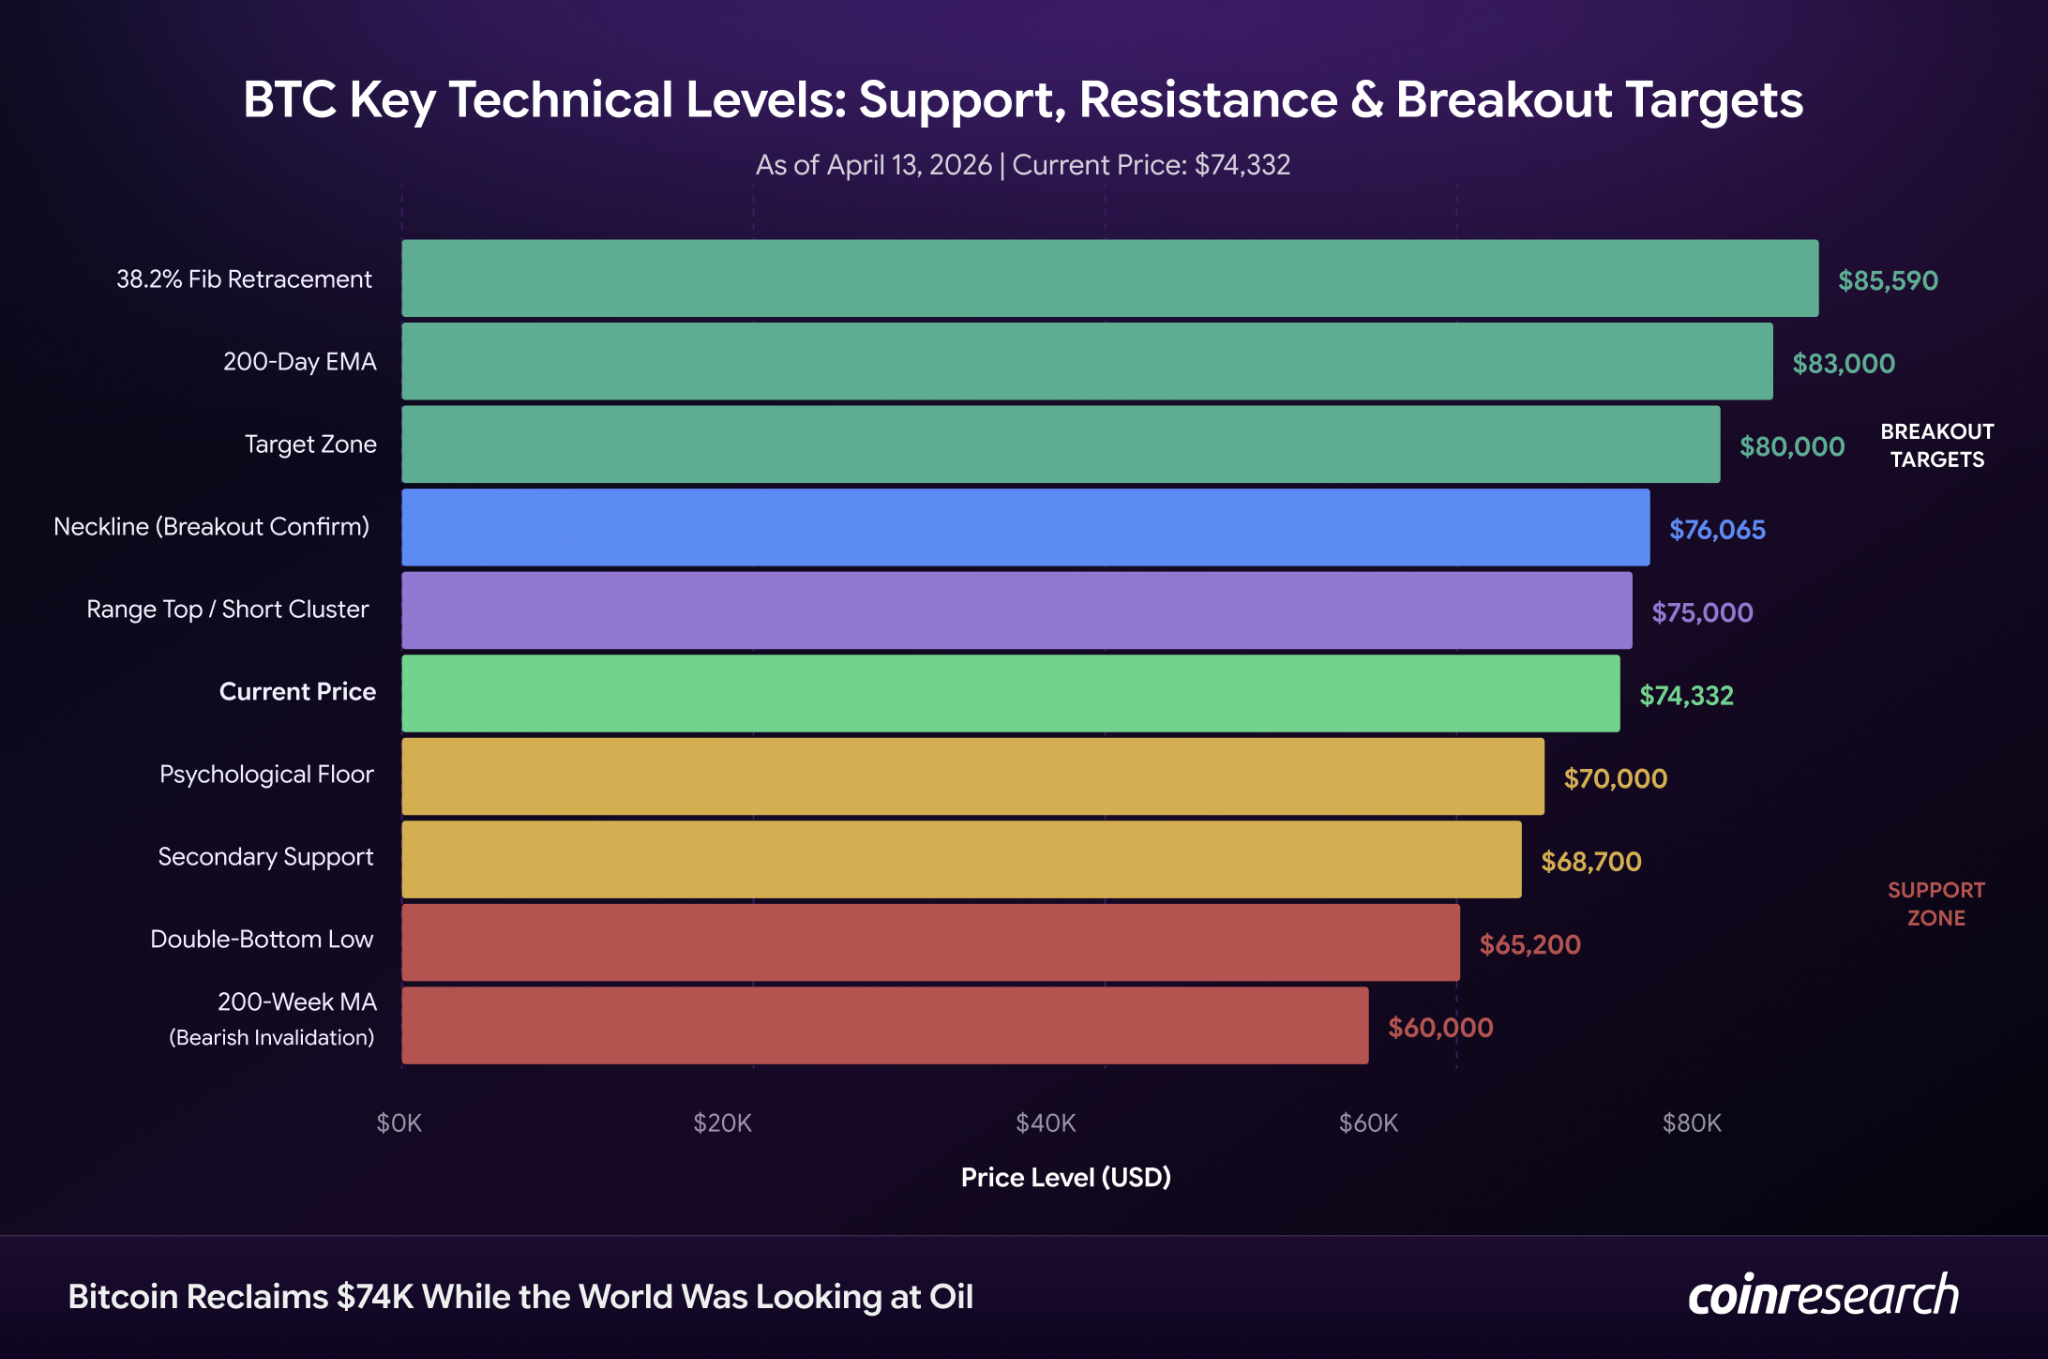
By April 13, a new cluster of roughly $6 billion in shorts had accumulated between $72,200 and $73,500 — setting up the potential for a second squeeze if price pushes through $75,000 with conviction.
Catalyst #3: Morgan Stanley’s MSBT
On April 8 — the same day the ceasefire rally was unfolding — Morgan Stanley launched MSBT on NYSE Arca. It was the first spot Bitcoin ETF ever issued directly by a major U.S. bank.
The fund launched with a 0.14% expense ratio, undercutting BlackRock’s IBIT by 11 basis points. Morgan Stanley employs 16,000 wealth advisors overseeing $6.2 trillion in client assets. Since 2024, those advisors could recommend third-party Bitcoin ETFs. Now they can recommend their own.
Bloomberg’s Eric Balchunas ranked the debut in the top 1% of all ETF launches ever. MSBT isn’t the first Bitcoin ETF. It’s the first one that comes with a $6.2 trillion distribution machine attached.
The broader ETF landscape reinforced the bid: spot BTC ETFs entered their second consecutive month of net inflows after four straight months of outflows. The April 6 single-day sector inflow hit $471 million — the strongest in over a month.
The Bigger Picture
The rally didn’t happen because the macro improved. It happened despite the macro.
Oil at $104. March CPI at 3.3% — highest since May 2024. Fed holding at 3.50–3.75% with all 2026 rate cuts priced out. Bitcoin historically trades with 85% Nasdaq correlation during oil spikes, which should have suppressed the bid.
Yet when Trump ordered the Hormuz blockade on April 12, Bitcoin defended $70,000 and closed Monday at $73,400. That playbook break is new. BTC is starting to trade less like a leveraged tech bet and more like an asset that draws demand when traditional hedges get crowded.
Meanwhile underneath: Strategy bought 13,927 BTC for $1 billion last week, funded entirely through STRC preferred stock issuance. Whale wallets accumulated for the second consecutive week. The bid is structural, not speculative.
The Risks Are Real
This rally is fragile. Four risks stand out:
-
The ceasefire is dead. Peace talks collapsed over the weekend. The naval blockade is active. Oil back above $104.
-
Inflation isn’t cooperating. 3.3% CPI keeps rate cuts off the table until late Q3 at earliest. The Fed may even hike if conditions deteriorate.
-
Positioning is crowded. Bitfinex margin longs remain above 80,000 BTC — historically a contrarian signal that has preceded pullbacks.
-
Critical resistance ahead. $75,000 is loaded with shorts. Break it and a second squeeze opens the path to $80K. Reject and $70K gets retested. The next 48 hours decide.
The Bottom Line
The April rally wasn’t a gift from the macro. It happened despite $104 oil, 3.3% inflation, and an active military conflict. That’s the tell. When an asset rallies in a hostile environment, the bid is structural — not speculative.
Our model called it nine days early, from $67K. The question now isn’t whether the bid is real. It’s whether $75,000 is where the breakout confirms or where the range re-asserts.
This article is a preview of our full flagship Intelligence Report on Bitcoin’s April rally.
Read the complete deep-dive — including the full 9-day signal scorecard with confidence scores, the branded technical levels map with all 10 key price levels, three scenario probability breakdowns with specific 30-day targets, the full institutional flow data, and actionable position guidance for new and existing holders — on
Coinresearch delivers institutional-grade crypto research for investors who want signal, not noise.
Disclaimer: This article is for informational purposes only and does not constitute financial or investment advice. CoinResearch analysts may hold positions in assets discussed. Cryptocurrency investments are highly volatile and speculative. Always conduct your own due diligence before making any investment decisions.