
Bitcoin is down ~50% from its October peak and back at the $59,930 February floor. Five forces broke it at once. Here’s what each one did, and the single line that has to hold.
Bitcoin didn’t crash on one headline. It cracked under five at once.
The ETF era was supposed to make Bitcoin sturdier. Deep institutional pockets, a permanent bid, fewer reflexive boom-bust swings. For a while, that held.
Then the bid reversed. The funds built to absorb selling started doing the selling. And once price began to slip, everything that had been quietly stacking up underneath gave way together.
Bitcoin now trades near $63,500, down roughly 13% on the week and about 50% below its October 2025 all-time high of $126,198. It briefly cracked below $62,000 intraday. The Crypto Fear & Greed Index has collapsed to 11 (”extreme fear”), down from 55 just a week ago. The question in our report title is no longer hypothetical.

What Actually Happened
This wasn’t a single-day wipeout. It was a slow bleed that turned into a flush.
After topping at $126,198 in October, Bitcoin slid to a low of $59,930 on February 5, recovered to around $80,000 by April, then rolled over again through May. The first week of June is where it broke. The $68,000 floor went early in the week. Then $65,000. Now the market is hunting for a bottom in the low $60,000s, right where it found one in February.
Total crypto market cap has slipped back toward $1.27 trillion. Eight months after a record high, Bitcoin has given back half its value.
The bleak became a break the moment leverage and outflows started feeding each other.
Catalyst One: The ETF Exodus
The products meant to be Bitcoin’s stable bid became its biggest seller.
U.S. spot Bitcoin ETFs shed $1.42 billion in the week of May 25–29 alone, the third-largest weekly outflow on record. The bleed has since stretched into an 11-day streak totaling roughly $3.45 billion. BlackRock’s IBIT did most of the damage, accounting for about $966 million of that single week. Across all issuers, the funds sold roughly 19,021 BTC.
The tell is where the money went. While Bitcoin ETFs bled, spot products for Solana and XRP kept taking inflows. This wasn’t capital fleeing crypto. It was capital rotating out of Bitcoin specifically.
Tactical money is the first to leave when the tape turns. That’s exactly what the flows showed.
Catalyst Two: The Leverage Flush
Outflows set the direction. Leverage supplied the violence.
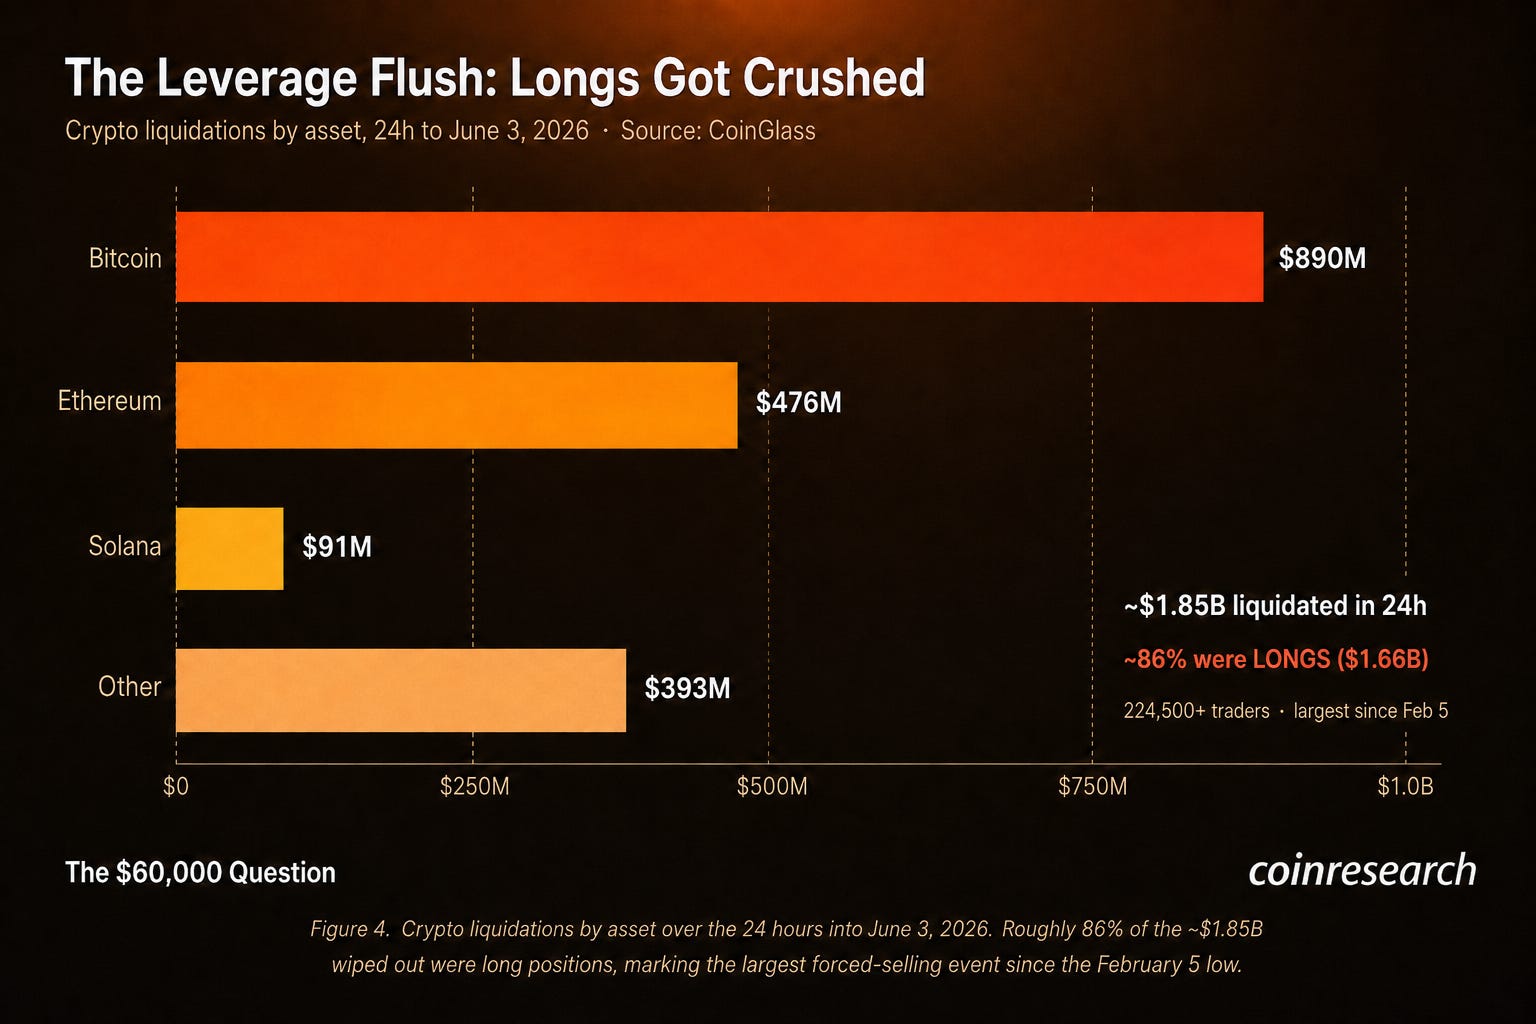
As Bitcoin broke $70,000 and then $68,000, over-extended longs began to cascade. In one 24-hour stretch, roughly $1.85 billion in leveraged positions were force-closed, the largest liquidation event since the February low, catching more than 224,500 traders.
The carnage was one-sided. About 86% of it, $1.66 billion, was long positions. Each forced sale dropped price, which triggered the next tier of longs, which dropped price again.
The grim upside: this kind of flush is cleansing. It removes the fuel for the next leg down.
Catalyst Three: Saylor Blinked
The most powerful catalyst moved the least money.
Strategy (formerly MicroStrategy) disclosed it sold 32 BTC for about $2.5 million, its first Bitcoin sale since 2022. On the math, it’s nothing: 0.0038% of its 843,706 BTC, sold to fund preferred dividends. The company even bought more BTC in the same window.
On the narrative, something cracked. For five years the entire thesis rested on one promise: Strategy buys and never sells. That promise is what made the stock a leveraged Bitcoin proxy instead of a fund that trades its position.
MSTR fell 5–6% on the news. The market wasn’t pricing $2.5 million of supply. It was pricing the end of an article of faith.
The Overhang and the Macro Trap
Two slower forces sit underneath the price.
First, Mt. Gox. Estate wallets moved 10,422 BTC (~$739 million) on June 2, the largest transfer in months, ahead of an October 31 creditor deadline. The reflex fear is supply. But the coins remain unspent, with no exchange inflow detected. For now it’s an administrative shuffle, not selling. The tell is the second hop, not the first.
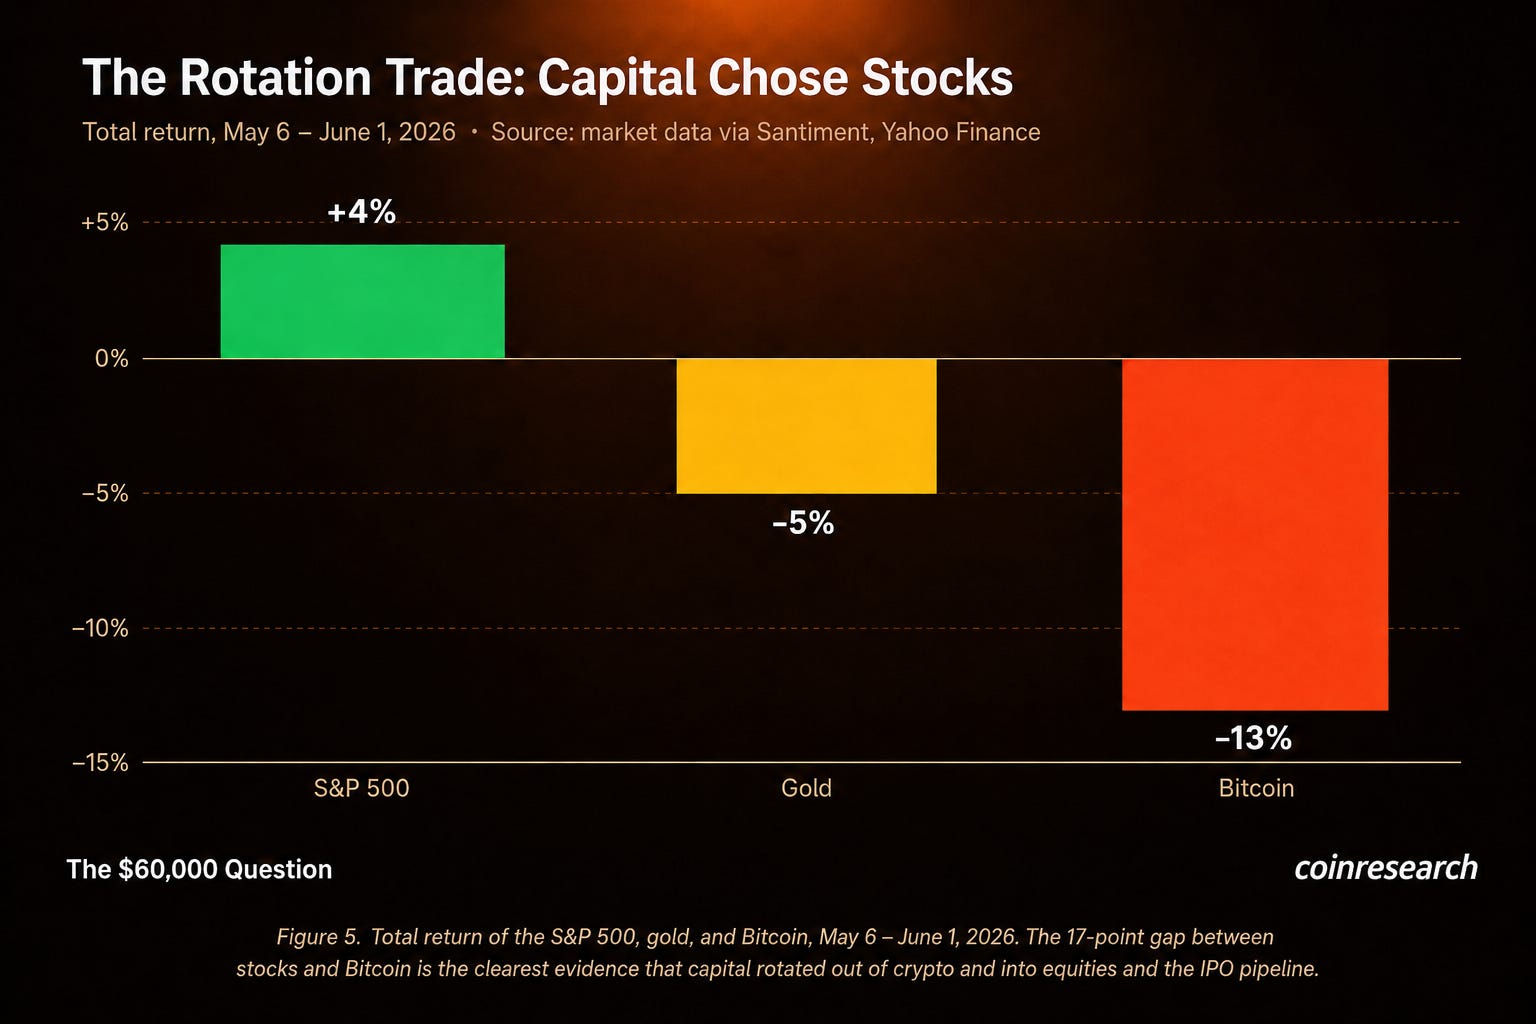
Second, and more important, the macro trap. Inflation is running at 3.8%, the Fed is on hold at 3.50–3.75%, and prediction markets price roughly a 69% chance of zero rate cuts in all of 2026. When cash yields more than 4% with no easing in sight, the opportunity cost of a non-yielding asset rises. Capital did the rational thing: from May 6 to June 1, the S&P 500 rose ~4% while Bitcoin fell ~13%.
The Levels That Matter Now
The map is unusually clean.
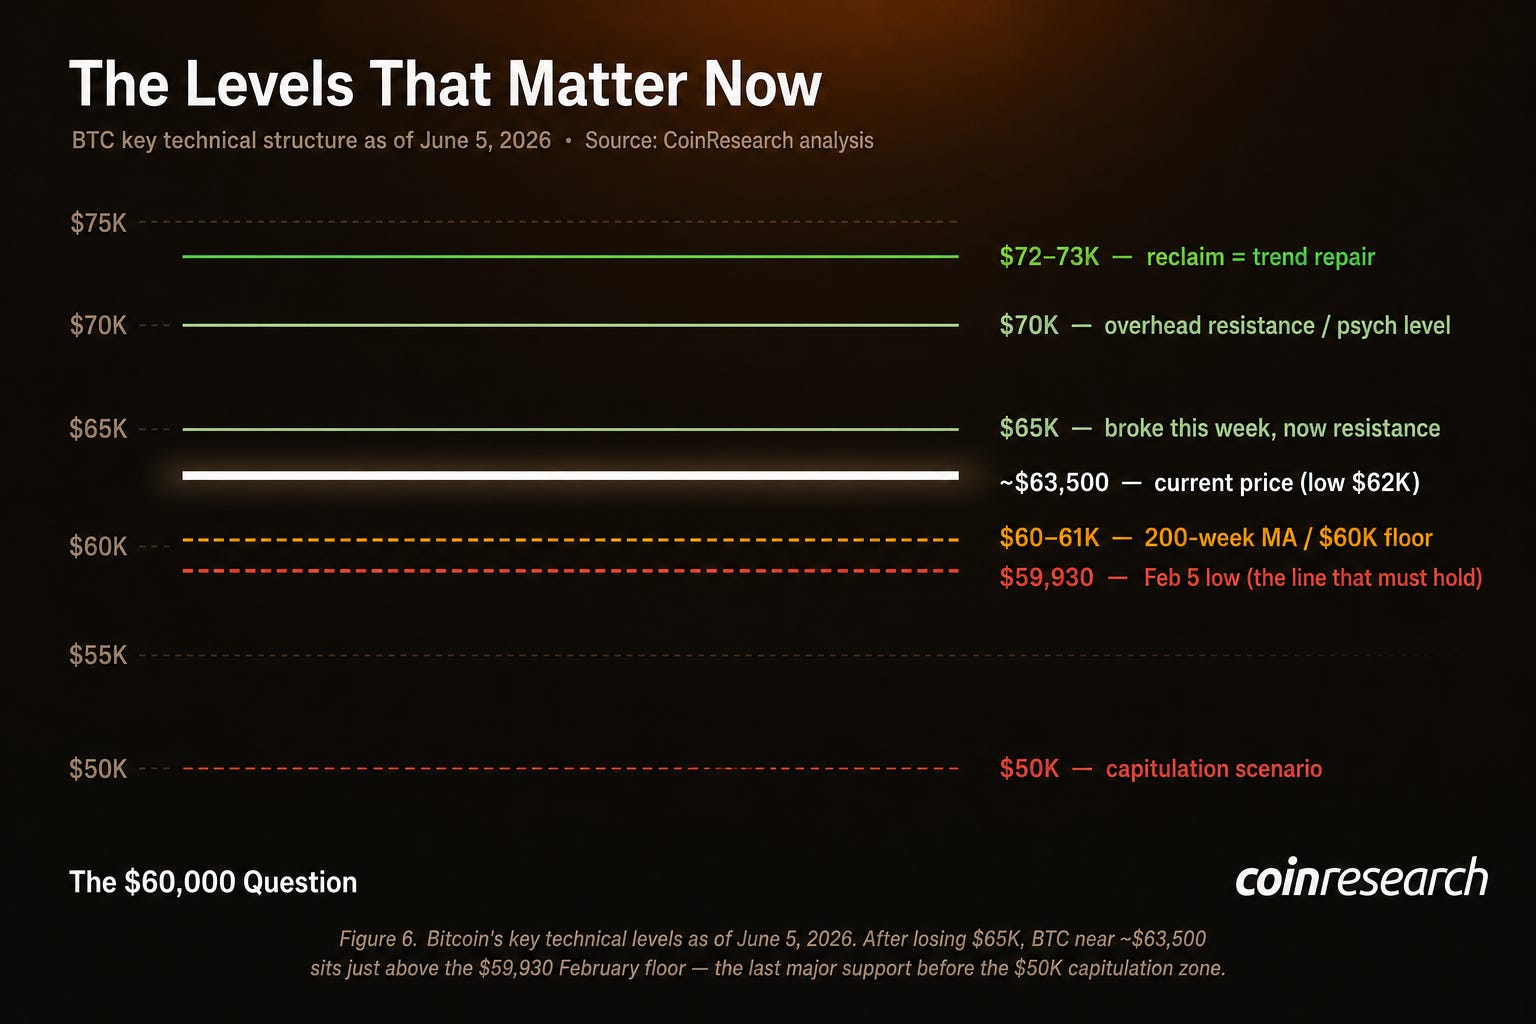
Bitcoin lost $65,000 this week, and that level now flips to overhead resistance. At ~$63,500, only two things stand between price and a deeper drop: the $60–61K zone (the 200-week moving average and the round-number floor) and the $59,930 February low. Lose that on a weekly close and the next real support is the $50,000 region traders are openly discussing.
The weekly RSI has fallen into the low 20s, deeply oversold, a zone that has historically marked local bottoms. On the upside, a reclaim of $65K then $70K is the first sign the trend has repaired.
The $59,930 line is the whole ballgame.
What Comes Next
Three paths, into a dense calendar that includes the May CPI print and the June 16–17 Fed meeting.
The base case is stabilization: the $59,930–$65,000 zone holds, the leverage flush proves to be a local capitulation, and a softer macro signal steadies risk. The bear case is a clean break of $59,930 that opens the door toward $50,000, driven by a hot inflation print, a hawkish Fed, or Mt. Gox coins finally hitting an exchange. The bull case, least likely given the macro backdrop, is a dovish surprise that squeezes the one-sided positioning back above $70,000.
The single biggest variable is no longer crypto-native. It’s whether the Fed gives risk assets any reason to believe easing is still on the table this year.
The Bottom Line
This is a sentiment, leverage, and macro drawdown, not a break in Bitcoin’s fundamentals. Five forces landed at once on a hostile-but-not-deteriorating backdrop: the kind of move that resets a market rather than ending it. But resets still have to find a floor, and Bitcoin is now testing the exact one it set in February. Hold $59,930 and this was a flush. Lose it and the $60,000 question gets a much harder answer.
This article is a preview of our full flagship Intelligence Report on Bitcoin’s June 2026 drawdown.
Read the complete deep-dive — including the three scenario probabilities with specific price targets, the full branded technical levels map, the complete ETF and liquidation flow data, and our risk-adjusted guidance for new vs. existing investors — on
CoinResearch delivers institutional-grade crypto research for investors who want signal, not noise.
Disclaimer: This article is for informational purposes only and does not constitute financial or investment advice. CoinResearch analysts may hold positions in assets discussed. Cryptocurrency investments are highly volatile and speculative. Always conduct your own due diligence before making any investment decisions.