
The Reclaim Has a Narrow Base | Week Ending July 19, 2026

1. The Reclaim Has a Narrow Base
Bitcoin closed the week at $64,680, up +1.5% week-on-week, while Ethereum closed at $1,871, up +3.6%. The pair recovered from the midweek sell-off, but the structure beneath them remains selective. BTC traded between $61,849 and $65,385, ETH between $1,756 and $1,931, and total crypto market capitalization finished near $2.30 trillion. Bitcoin dominance rose to 56.5% while ETH dominance reached 9.8%. Those figures describe a repair in the majors, not a broad altcoin rotation.
Sentiment has not confirmed the price recovery. Fear & Greed closed Sunday at 28 – Fear and printed 29 on Monday after spending much of the week at Extreme Fear. Spot ETF demand improved from the June washout, but daily flows remain uneven rather than a persistent institutional bid. The immediate macro calendar is light, but jobless claims on Thursday and flash PMIs on Friday will set the tone ahead of the July 28-29 FOMC meeting. This week’s calendar and the Federal Reserve schedule matter because the market is still trading every sign of growth resilience and rate sensitivity.
Key themes this week:
-
BTC and ETH recovered, but BTC dominance rose and high-beta leadership did not follow.
-
Fear remains entrenched despite the price bounce, leaving the market vulnerable to renewed macro stress.
-
The raw model is constructive on BTC and AAVE, decisively bearish on DOT, and conditionally bearish on NEAR.
-
The week favors selective entries, modest sizing, and defined invalidation over broad long exposure.
2. Strengths: What Is Holding
-
BTC absorbed another meaningful downside test. The week low at $61,849 held and BTC reclaimed the mid-$64,000s rather than closing near the lows. That gives the market a visible tactical floor and explains why the raw model is constructive over three and seven days. The caveat: BTC has not yet held above the $65,385 weekly high. Until it does, this remains a recovery inside a range.
-
ETH improved faster than BTC. Ethereum’s +3.6% weekly close and its rise in market-cap dominance show that the market is not treating every non-BTC asset as uninvestable. The caveat: the move has not become broad leadership. Solana rose only +0.8%, Dogecoin +0.7%, and Hyperliquid fell -10.1% over the same week.
-
The ETF picture is less hostile than it was in June. US spot BTC ETF flows regained some positive sessions in early July after heavy June redemptions, and both BTC and ETH funds saw inflows return during the week. CoinDesk’s flow coverage is useful context. The caveat: the flow path is still choppy. A rebound in flows is not the same thing as a sustained allocation cycle.
-
Fear creates room for a recovery if support holds. A 29 Fear reading means the market is far from complacent. That matters because a durable hold above support can force under-positioned participants to re-engage. The caveat: fear can be contrarian only after price confirms it; it is not a buy signal by itself.
3. Weaknesses: What Has Not Been Repaired
-
Breadth remains narrow. BTC and ETH closed green, yet Hyperliquid lost more than 10% and BNB and TRX were lower on the week. That mix says capital is choosing exposure rather than expanding it across beta. A true rotation would show the liquid alt complex participating together.
-
Bitcoin dominance rose with the rebound. BTC dominance at 56.5% is inconsistent with the start of a broad altcoin advance. It tells us that the market still prefers the most liquid asset when risk appetite improves only marginally.
-
The model’s bearish side is concentrated in smaller and older beta. FLOW, SUPER, ONT, and several other low-cap assets ranked highly in the raw downside screen. We excluded them from the featured calls because their liquidity is too thin for an institutional weekly setup.
-
Macro risk has been deferred, not removed. Weekly jobless claims arrive Thursday, July 23, followed by July flash manufacturing and services PMIs on Friday, July 24. The next FOMC meeting follows on July 28-29. A market with Fear & Greed below 30 will react sharply if those data revive a higher-for-longer narrative.
4. Market Recap: Weekly Performance
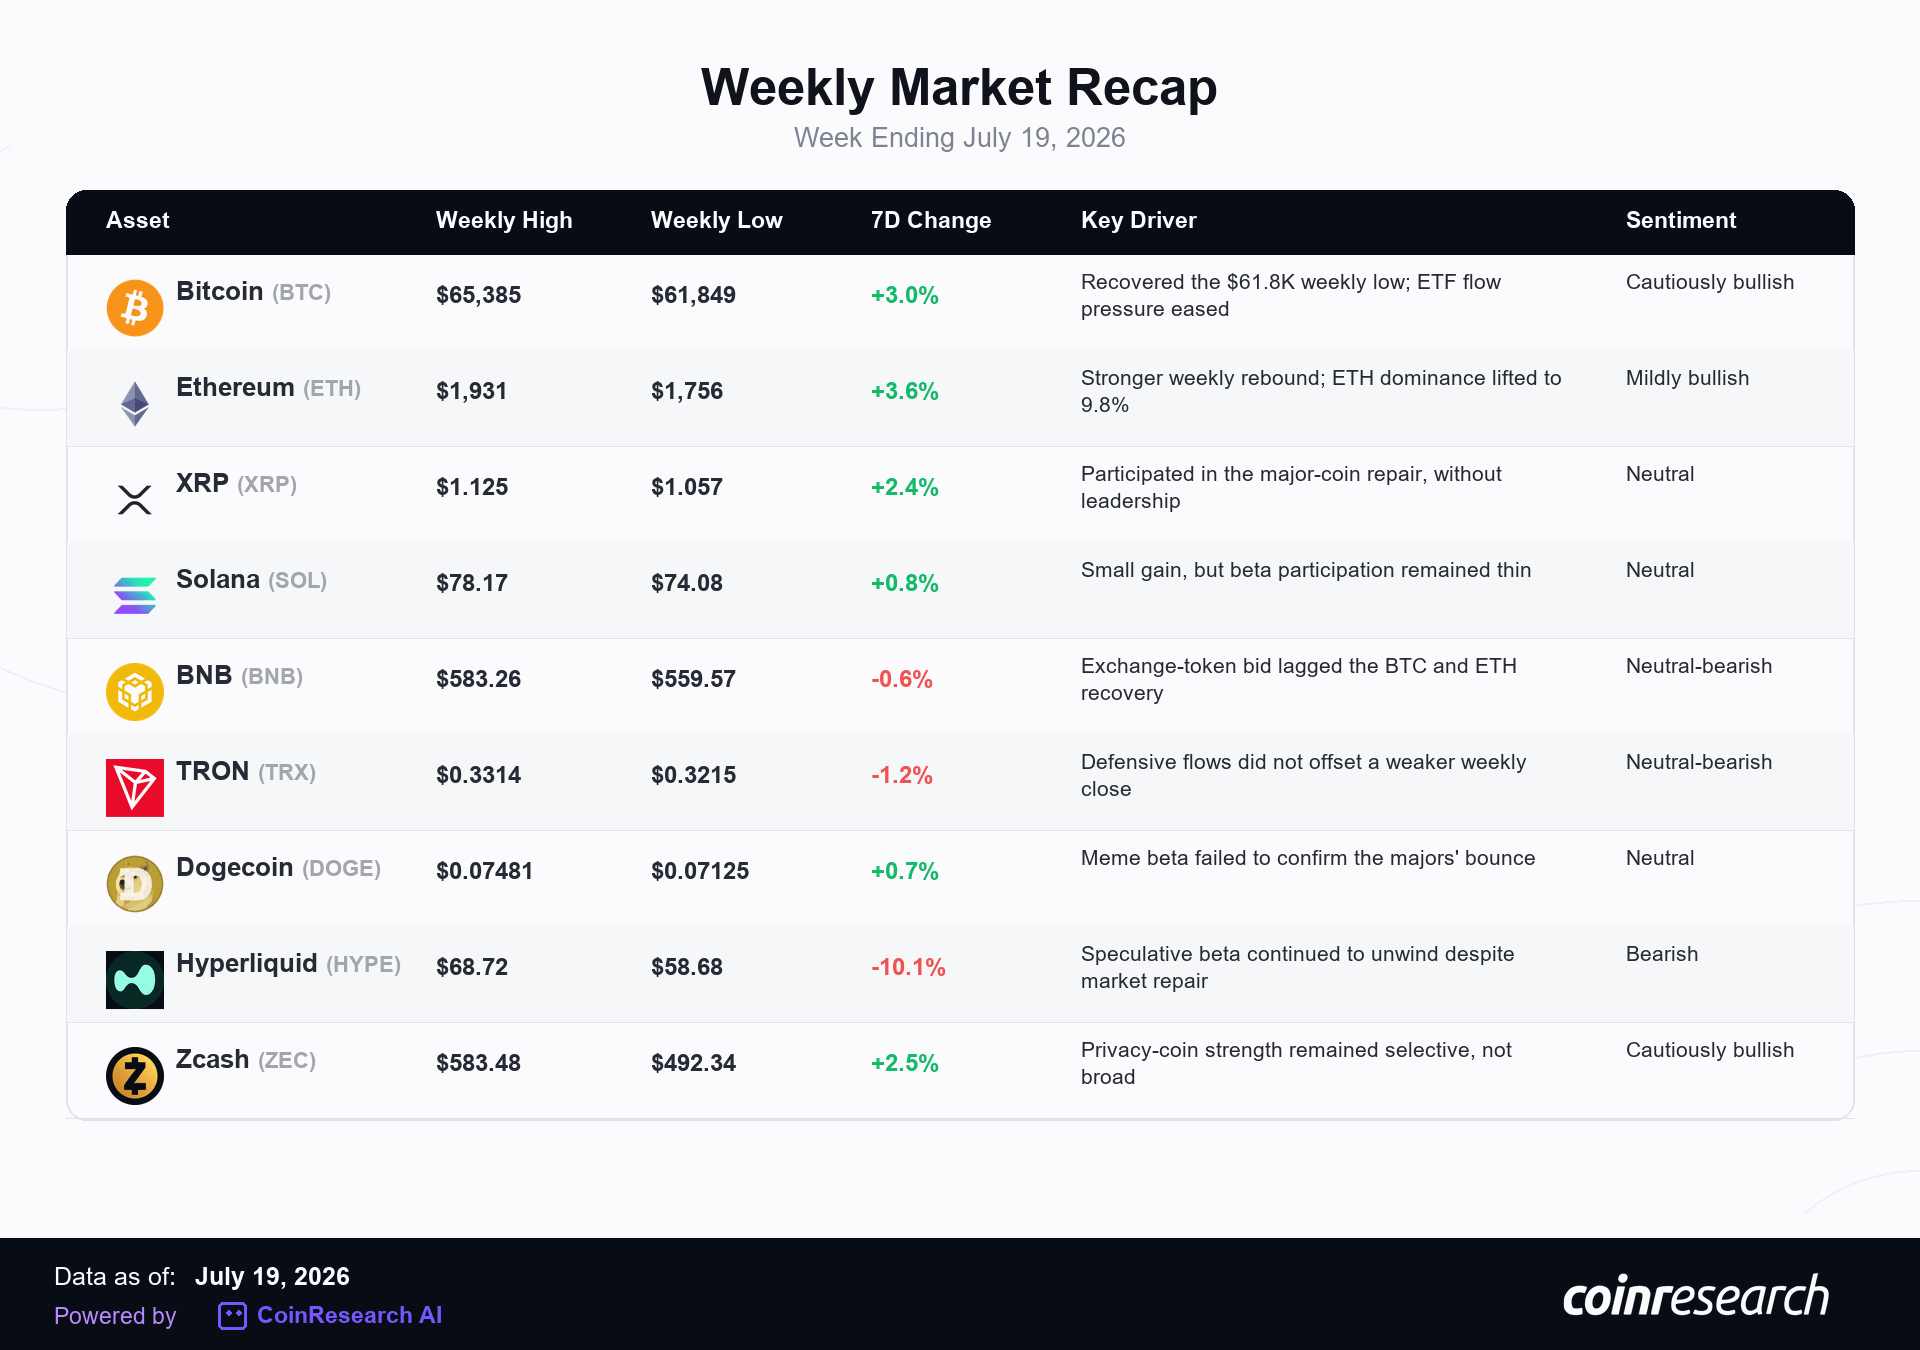
BTC finished the week at $64,680 (+1.5% W/W) and ETH at $1,871 (+3.6%). XRP added +2.4% and Zcash +2.5%, but the rest of the large-cap board did not deliver a uniform confirmation. Solana rose +0.8%, Dogecoin +0.7%, BNB fell -0.6%, TRX fell -1.2%, and HYPE dropped -10.1%. The correct read is not that the bounce failed. It is that the bounce has a narrow base: majors can recover while the speculative cohort remains fragile.
5. Predictive Analytics & Trade Confluence
Disclaimer: The insights and forecasts presented here are generated by CoinResearch AI’s predictive models and supporting analytics. They are provided for informational and educational purposes only and do not constitute financial advice or investment recommendations. Trading digital assets involves risk, and users should conduct their own research, exercise independent judgment, and use appropriate risk management before making any investment or trading decisions.
DOT-USD (Polkadot)
Reference Price: $0.810
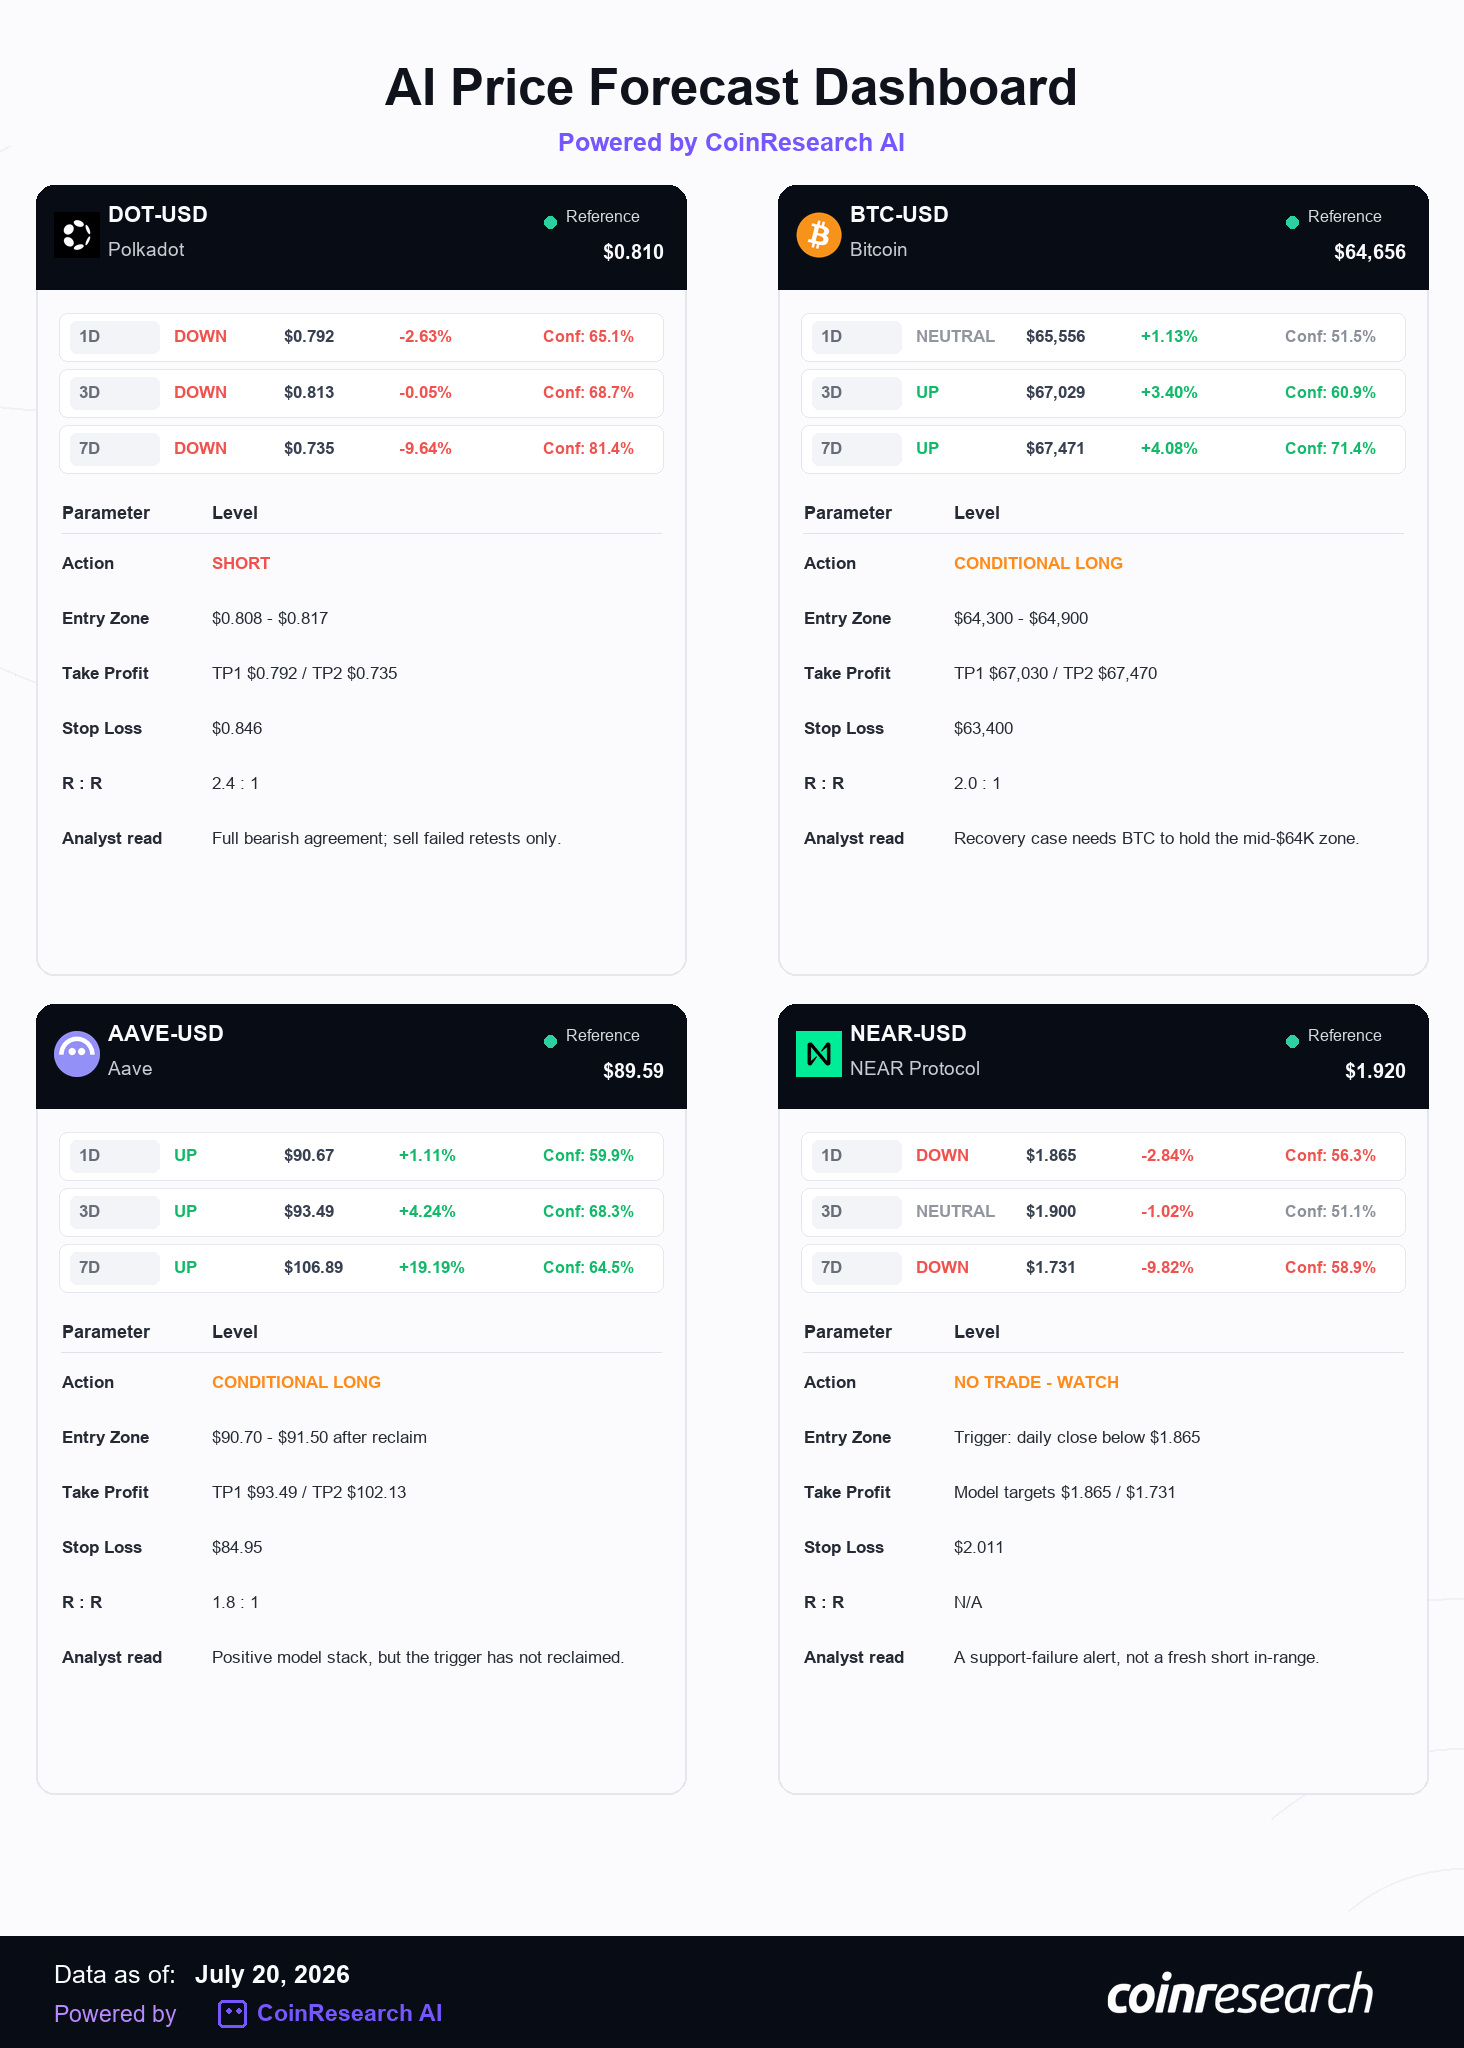
Market Confluence Analysis. DOT is the strongest raw directional signal in the entire current database. Both model versions point DOWN across 1D, 3D, and 7D, and the regression targets agree: $0.792 in one day and $0.735 over seven days. The seven-day confidence is 81%, materially above the rest of the featured slate. The likely observable cause is persistent relative weakness rather than a one-session shock: DOT is down 2.1% over seven days and 15.2% over 30 days while BTC recovered. The model is reading that failed participation as a continuation risk.
Polkadot continues to ship economic and decentralization work, including its Dynamic Allocation Pool and issuance reforms, but those developments have not translated into market leadership. Parity’s recent technical update is a reminder that product progress and token demand can diverge. Broad Fear and the market’s preference for BTC reinforce the downside regime. Our interpretation is that the bearish cause remains durable until DOT can reclaim the recent range, but the live price is already close to the one-day target. Entry discipline is essential.
Trade Action.
-
Action: Short on a failed retest of $0.808-$0.817.
-
Entry Zone: $0.808-$0.817.
-
Take Profit: TP1 $0.792; TP2 $0.735.
-
Stop Loss: $0.846, near the model’s one-day ATR ceiling.
-
R:R: Approximately 2.4:1 to TP2 from the middle of the entry zone.
-
Rationale: Full cross-horizon and cross-model downside agreement, with live price still near the fresh model reference.
-
Invalidation: A sustained reclaim above $0.846 invalidates the near-term bearish structure.
-
Analyst Note. The model is clear and the market is not contradicting it. DOT is the one active bearish setup this week, but it should be sold into a weak retest rather than chased through the first target.
-
Verdict: SHORT, with retest discipline.
BTC-USD (Bitcoin)
Reference Price: $64,656
Market Confluence Analysis. BTC’s one-day classifier is neutral, but the 3D and 7D models both turn UP with 61% and 71% confidence, projecting $67,029 and $67,471 respectively. The causal explanation is visible in the tape: BTC absorbed the $61,849 weekly low, reclaimed the middle of its range, and outperformed the broader high-beta cohort while ETF flows stopped being uniformly negative. The model is therefore not calling for an immediate breakout; it is assigning higher odds to a continuation after consolidation.
The limiting factor is sentiment and macro. Fear & Greed at 29 and uneven ETF flows leave the bid vulnerable, while jobless claims and PMIs can quickly reprice risk. Our view is that BTC has the best chance of sustaining a recovery because capital is still concentrating in liquidity, but the neutral one-day signal means the trade must be treated as a hold-above-support setup, not a momentum chase.
Trade Action.
-
Action: Conditional Long.
-
Entry Zone: $64,300-$64,900, only while BTC holds the zone.
-
Take Profit: TP1 $67,030; TP2 $67,470.
-
Stop Loss: $63,400, close to the one-day model ATR floor.
-
R:R: Approximately 2.0:1 to TP2 from the middle of the entry zone.
-
Rationale: 3D and 7D model agreement, a defended weekly low, and a market still favoring BTC over broad beta.
-
Invalidation: A decisive loss of $63,400 returns BTC to range-failure risk.
-
Analyst Note. The model says the next several days are better than the next several hours. That is compatible with a patient long, not leverage added into a local spike.
-
Verdict: CONDITIONAL LONG.
AAVE-USD (Aave)
Reference Price: $89.59
Market Confluence Analysis. AAVE is the strongest upside altcoin in the raw scan. Its 1D, 3D, and 7D direction signals are all UP, with the latter two models agreeing across versions and projecting $93.49 and $106.89. The likely cause is a mean-reversion-plus-trend setup: AAVE is down 6.7% over seven days, but remains up 22.4% over 30 days. The model is reading the weekly drawdown as a pullback inside a stronger monthly regime rather than as a completed trend reversal.
That causal story is plausible, but it is not yet confirmed by relative strength. AAVE is still trading below its one-day target, and the one-day versions disagree, with one model neutral and the other bullish. Aave governance activity, including a proposal to deploy V4 on Avalanche, supports a live protocol narrative but does not guarantee immediate token demand. Aave governance should be monitored as context, not traded as a headline. With Fear still elevated and breadth narrow, we prefer confirmation before exposure.
Trade Action.
-
Action: Conditional Long after reclaim.
-
Entry Zone: $90.70-$91.50 after price reclaims the one-day forecast zone.
-
Take Profit: TP1 $93.49; TP2 $102.13, the model’s seven-day ATR ceiling.
-
Stop Loss: $84.95, near the one-day ATR floor.
-
R:R: Approximately 1.8:1 to TP2 from the middle of the entry zone.
-
Rationale: Positive cross-horizon forecast, strong seven-day historical directional accuracy, and a weekly reset within a positive monthly trend.
-
Invalidation: A loss of $84.95 means the expected pullback has become structural damage.
-
Analyst Note. We deliberately cap TP2 below the $106.89 point forecast because the model’s own seven-day ATR range tops near $102.13. A point estimate is not a promise.
-
Verdict: CONDITIONAL LONG – wait for reclaim.
NEAR-USD (NEAR Protocol)
Reference Price: $1.920
Market Confluence Analysis. NEAR is the fourth featured asset because it is large and liquid enough to test the raw bearish signal without relying on a small-cap proxy. The 1D and 7D models are DOWN, targeting $1.865 and $1.731; both model versions agree at those horizons. The 3D classifier is neutral, however, and the seven-day directional accuracy is only 45%. The likely cause is the asset’s longer relative downtrend: NEAR is down 11.2% over 30 days even after a modest +1.3% weekly bounce.
There is a meaningful counterargument. NEAR continues to ship AI-agent and protocol work, while nearcore 2.9.0 reduced the maximum annual inflation rate from 5% to 2.5%. NEAR One’s update makes the fundamental backdrop less one-sided than DOT’s. We therefore read the model as a support-failure alert, not an instruction to short in the middle of the range.
Trade Action.
-
Action: No Trade – watch for support failure.
-
Trigger Level: A daily close below $1.865.
-
Model Targets: $1.865 in one day; $1.731 over seven days.
-
Risk Level: $2.011, the one-day ATR ceiling.
-
Rationale: 1D and 7D downside alignment, but a neutral 3D signal and an active fundamental countercase.
-
Invalidation: Holding above $1.865 keeps the model’s downside case unconfirmed.
-
Analyst Note. NEAR becomes useful only if price confirms the model by losing support. Until then, the incomplete horizon agreement and live development catalysts make a short premature.
-
Verdict: NO TRADE – breakdown watch.
6. Token Launch & Ecosystem Radar
The radar is built around projects with visible products, a defined or developing token path, and a monitoring question that matters more than an airdrop rumor. Each remains pre-TGE in the live checks, and none has appeared in the prior-edition tracker.
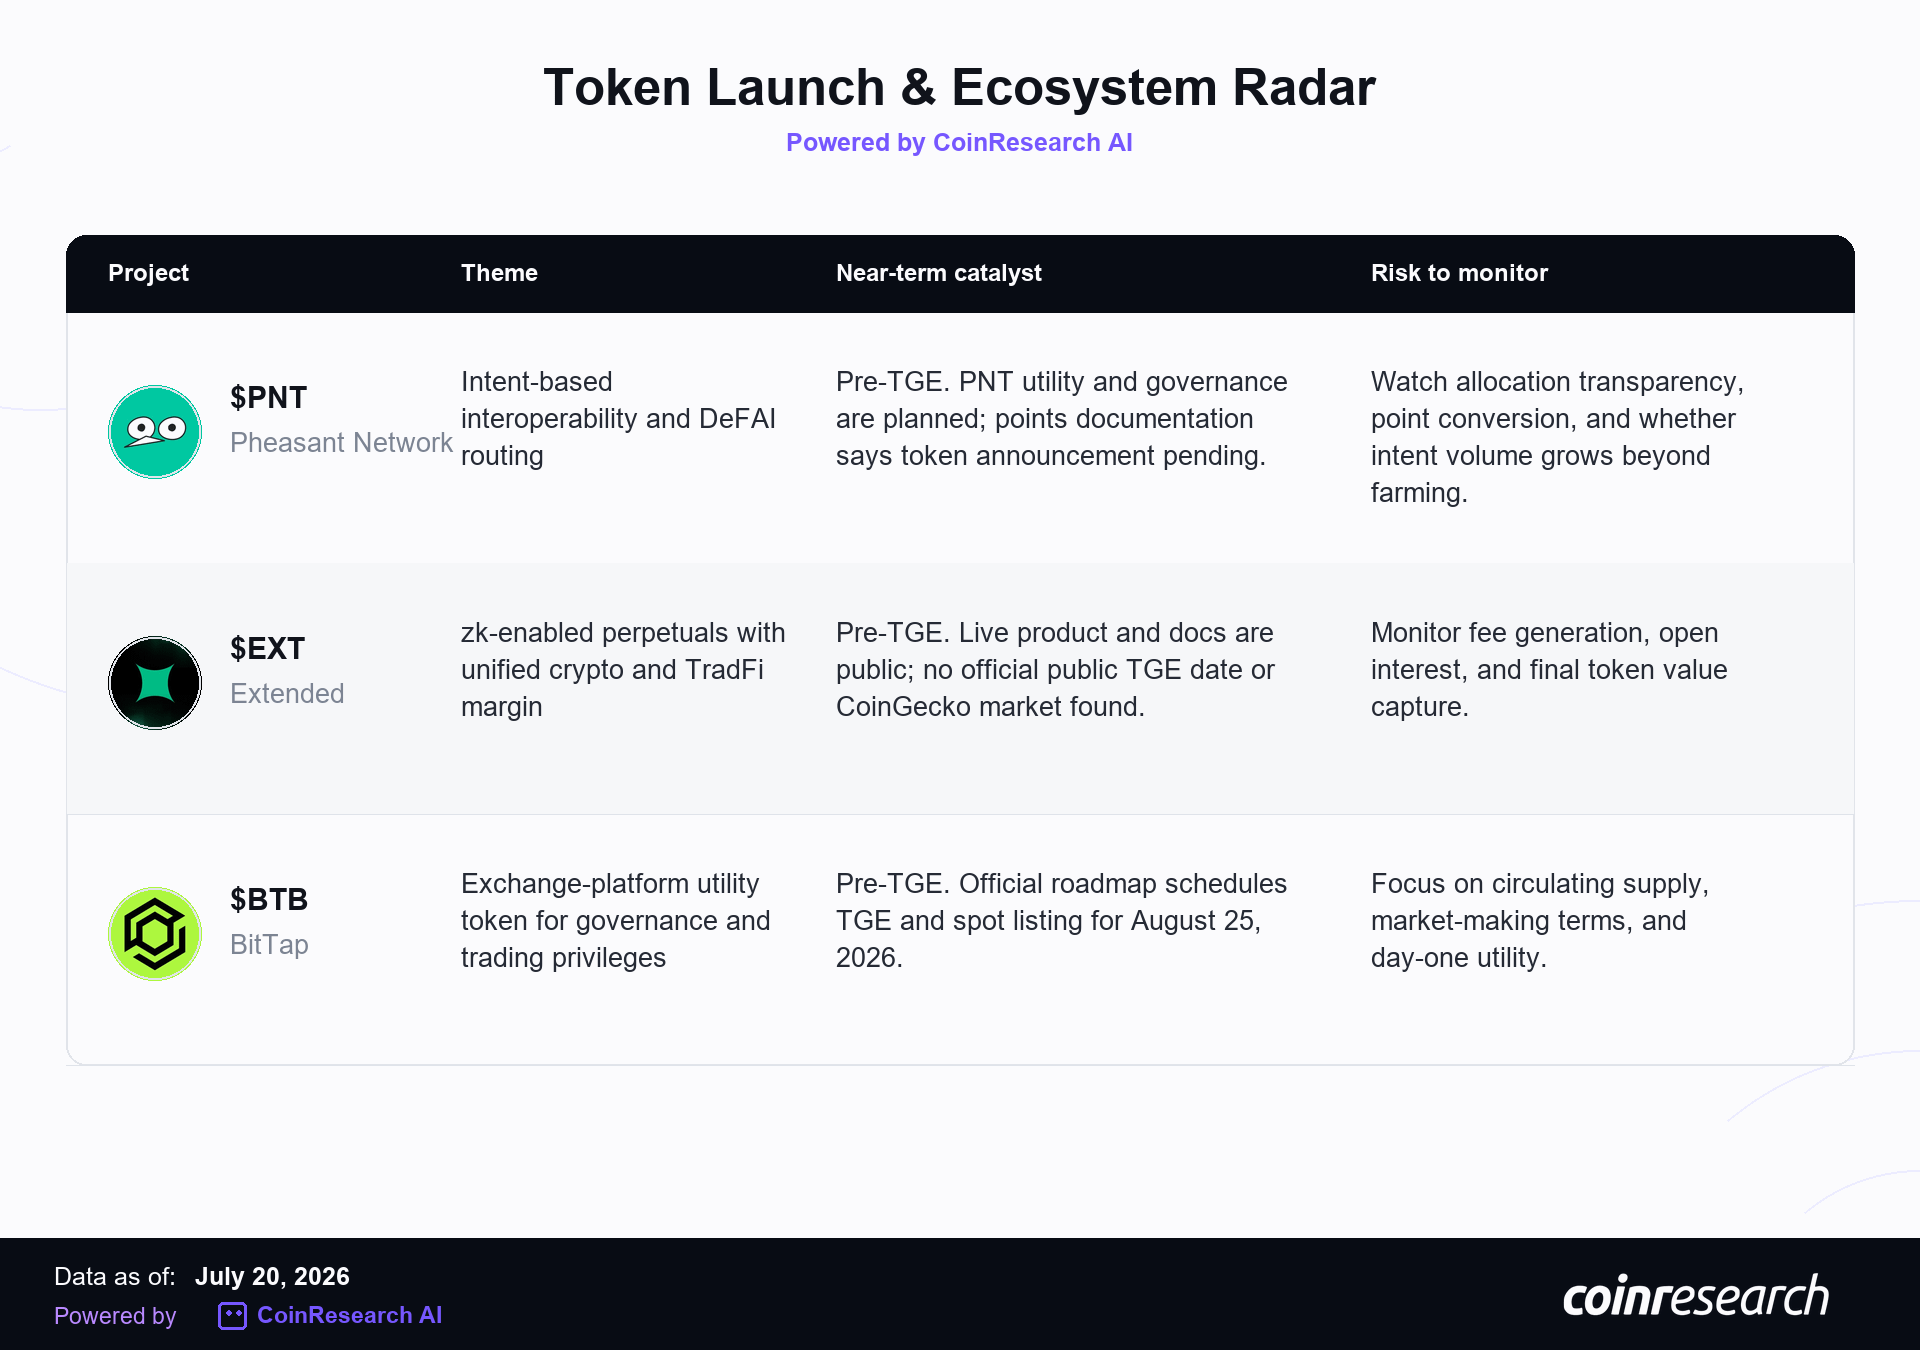
Pheasant Network ($PNT) – an intent-based interoperability layer positioning itself around DeFAI and cross-chain execution.
-
Why watch it: Pheasant is building the routing layer that lets users state an outcome rather than manually coordinate bridges, swaps, and chains. That makes it a useful test of whether the current AI-agent narrative can produce infrastructure demand rather than only token speculation.
-
Current Status: Pre-TGE. Official documentation describes PNT’s planned utility and governance role; its points documentation says a token announcement is still pending. CoinGecko shows metadata but no live market.
-
Monitoring Rationale: Watch the eventual allocation, whether points map transparently to supply, and whether intent volume grows independently of token farming.
Extended ($EXT) – a zk-enabled perpetuals venue combining crypto and traditional-market exposure under unified margin.
-
Why watch it: Extended addresses a real trading workflow: collateral fragmentation across crypto and TradFi products. Its appeal is operational rather than narrative-heavy, which is useful in a market where exchange tokens need a clear link to usage.
-
Current Status: Pre-TGE. The live product and documentation are available, but no official public TGE date or live CoinGecko market was found at publication.
-
Monitoring Rationale: Monitor points, fee generation, open interest, and the token’s final role in margin, governance, or incentives. A token without a clear value-capture path should be passed over regardless of pre-launch attention.
BitTap ($BTB) – an exchange-platform token with a stated governance, trading-privilege, and incentive role.
-
Why watch it: BTB is a clearer event-driven case than the other two. The question is whether the token improves an operating exchange’s user economics or simply creates a short-lived listing catalyst.
-
Current Status: Pre-TGE. BitTap’s official roadmap schedules TGE and spot listing for August 25, 2026; no live CoinGecko market was found in the current check.
-
Monitoring Rationale: Focus on circulating supply at launch, market-making terms, fee rebates, and whether utility is available on day one. The date is a catalyst; the distribution determines whether it is investable.
7. Strategic Recap & Forward Outlook
The model and the market now agree on the most useful conclusion: selectivity matters more than direction. BTC can continue higher without a broad altcoin rally, and a bearish DOT thesis can coexist with an AAVE recovery setup. The common error would be treating those calls as a mandate to maximize exposure. They are a map of conditions.
For this week, keep BTC long exposure conditional, treat DOT as the active relative-weakness short, wait for AAVE to earn its reclaim, and let NEAR prove its breakdown before acting. No trade is still a trade when the evidence is incomplete.
Forward Outlook – Week of July 20-26, 2026
-
Macro Watch. The Conference Board’s Leading Economic Index is due Monday, July 20. Initial jobless claims arrive Thursday, July 23, followed by July flash manufacturing and services PMIs and June new-home sales on Friday, July 24. The Federal Reserve meets July 28-29. The market’s first question is whether data preserve the soft-landing interpretation; the second is whether that is enough to keep ETF flows constructive.
-
BTC Key Levels. The immediate support zone is $63,400-$64,300, combining the raw one-day ATR floor with the model’s preferred long-entry band. Below that, the weekly low at $61,849 is the more consequential structural level. Resistance is $65,385, then the raw 3D/7D forecast cluster at $67,030-$67,470. A hold above the first zone favors the recovery thesis; a loss of it makes the lower weekly range relevant again.
-
Altcoin Outlook. Do not confuse ETH’s weekly strength with broad rotation. AAVE can become a useful relative-strength long only after reclaiming its trigger, while DOT remains the cleaner bearish expression of selective liquidity. NEAR is a support-failure watch, not a short yet. The most attractive altcoin decisions remain conditional because the market has not yet demonstrated that it will reward beta as a group.
For full prediction dashboards, trade setups, and live model signals, visit
CoinResearch Intelligence Weekly is published for educational and informational purposes only. Nothing in this newsletter constitutes financial advice. Cryptocurrency markets are highly volatile – past performance does not guarantee future results. Always conduct your own research and consult a qualified financial advisor before making any investment decisions.