
Good News, No Bid. | Week Ending August 16, 2026

1. Good News, No Bid.
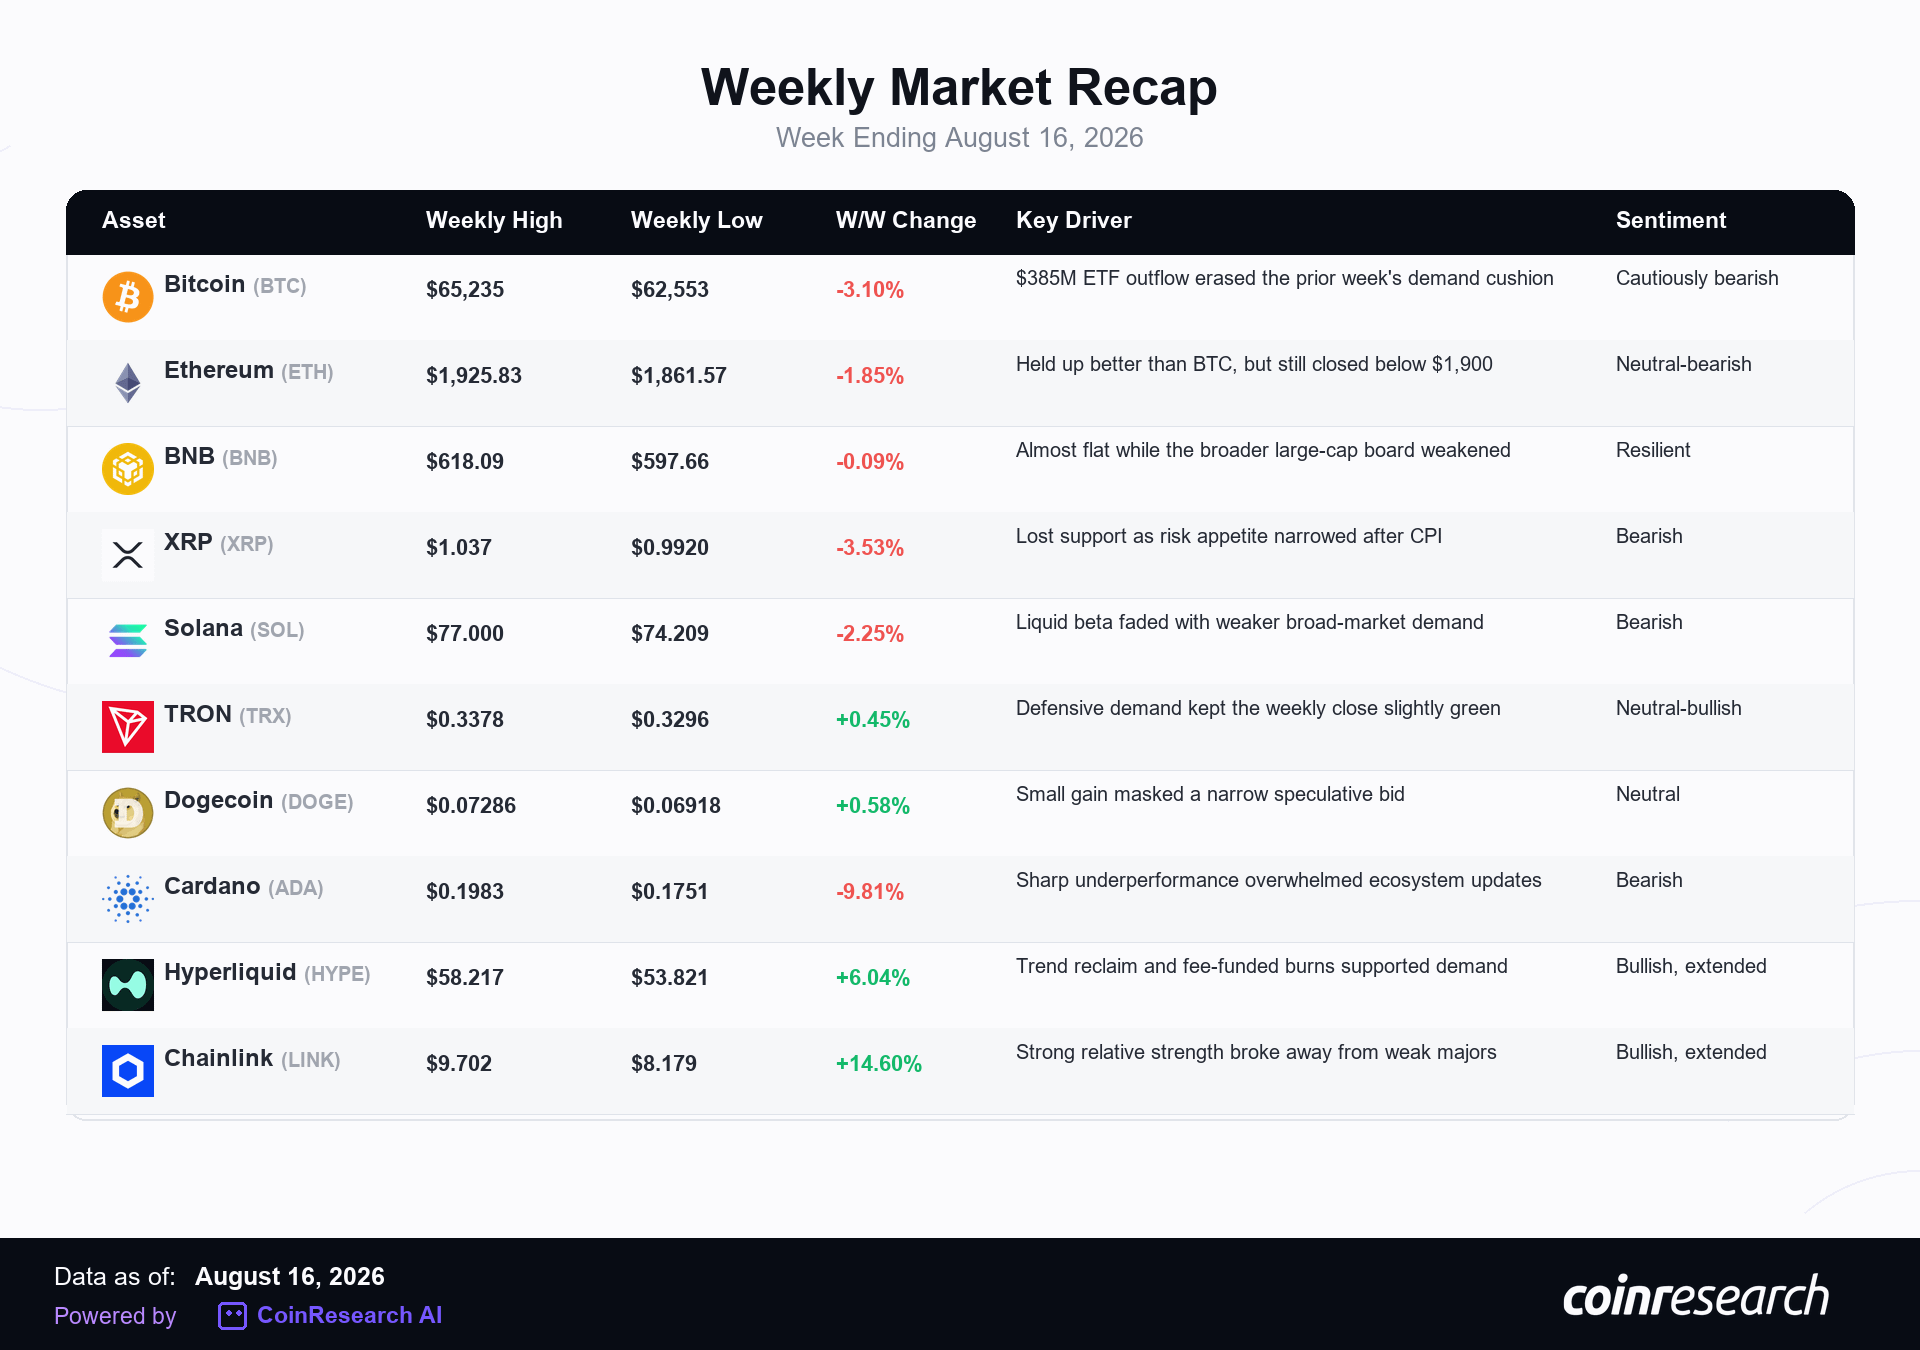
Bitcoin closed Sunday at $62,853, down 3.10% week-on-week, while Ethereum closed at $1,874, down 1.85%. The macro news was supposed to help. July headline CPI rose just 0.1% month-on-month, core CPI increased 0.2%, and retail sales fell 0.6%. Instead of rallying, crypto faded. The missing piece was demand. US spot Bitcoin ETFs lost approximately $385.2 million from August 10-14, reversing the prior week’s inflow, while spot Ethereum ETFs were roughly flat at -$3.0 million.
The market did not reject disinflation because lower inflation is bad. It rejected the idea that softer data alone can carry risk assets when marginal buyers are stepping back. Fear & Greed ended at 31 – Fear, BTC dominance held near 56.21%, and ETH dominance remained near 10.13%. The week produced a blunt message: better inflation data lowered one macro obstacle, but it did not create a bid. Until flows recover or price reclaims resistance without them, good news is just less bad news.
Key themes this week:
-
Inflation cooled, but BTC and ETH still closed lower.
-
Bitcoin ETF flows swung from strong inflows to a $385.2 million weekly outflow.
-
Breadth split hard: HYPE and LINK rallied while ADA, XRP, and SOL weakened.
-
The August 17 forecast favors downside, but the best raw calls are already sitting near support.
2. Strengths: What Is Holding
-
Bitcoin held the lower end of its recent range. BTC traded near $62,553 during the week and closed only modestly above that low. It did not break the $60,000 psychological level despite persistent ETF selling and weak risk appetite.
-
Inflation pressure eased at the consumer level. Headline CPI rose 0.1% in July and core CPI increased 0.2%. Year-on-year readings slowed to 3.4% and 2.5%, respectively. The data removed some of the immediate inflation shock that had complicated the policy outlook.
-
Several liquid tokens showed real relative strength. HYPE gained 6.04% from Sunday close to Sunday close, TRX added 0.45%, and DOGE rose 0.58%. Chainlink was the bigger outlier outside the top-market-cap recap set, advancing roughly 14.60%.
-
HYPE repaired the level that broke last week’s short thesis. Our prior failed-retest short stopped at $57.80. Price then held above that invalidation and pushed toward $59. That is not a reason to chase, but it is a reason to respect the new structure.
3. Weaknesses: What Has Not Been Repaired
-
ETF demand reversed. Spot BTC products recorded net outflows on four of five sessions, and the five-day total landed near -$385.2 million. The prior week’s institutional cushion disappeared almost immediately.
-
Crypto failed the easy macro test. Cooler CPI and softer retail sales normally give traders a clean excuse to add duration and risk. BTC still lost 3.10% week-on-week. When an asset cannot rally on friendly news, the market is telling us that positioning and demand matter more than the headline.
-
Large-cap breadth remained weak. ADA fell 9.81%, XRP lost 3.53%, SOL declined 2.25%, and LEO dropped 3.97% on the Sunday-close comparison. BNB was almost flat at -0.09%, which counted as resilience rather than leadership.
-
Ethereum still did not lead. ETH fell less than BTC, but it stayed below $1,900 at the Sunday close and ETH dominance remained near 10.13%. A broader altcoin recovery still needs Ethereum to attract sustained capital, not merely decline a little less.
4. Market Recap: Weekly Performance
The week was weaker than the headline inflation data suggested. BTC fell 3.10% and ETH lost 1.85%. XRP, SOL, ADA, and LEO all closed lower, while BNB finished almost unchanged. HYPE was the clearest liquid-major winner at +6.04%, followed by modest gains in DOGE and TRX. Total crypto market capitalization stood near $2.26 trillion at the research pull. This was not a uniform selloff. It was a market with narrow winners, weak index leadership, and no reliable institutional cushion.
5. Predictive Analytics & Trade Confluence
Disclaimer: This section combines CoinResearch AI forecast analysis with separately labeled analyst setups outside the current forecast universe. All material is provided for informational and educational purposes only and does not constitute financial advice or an investment recommendation. Trading digital assets involves risk. Readers should conduct their own research, exercise independent judgment, and use appropriate risk management.
POL-USD (POL)
Reference Price: $0.0751
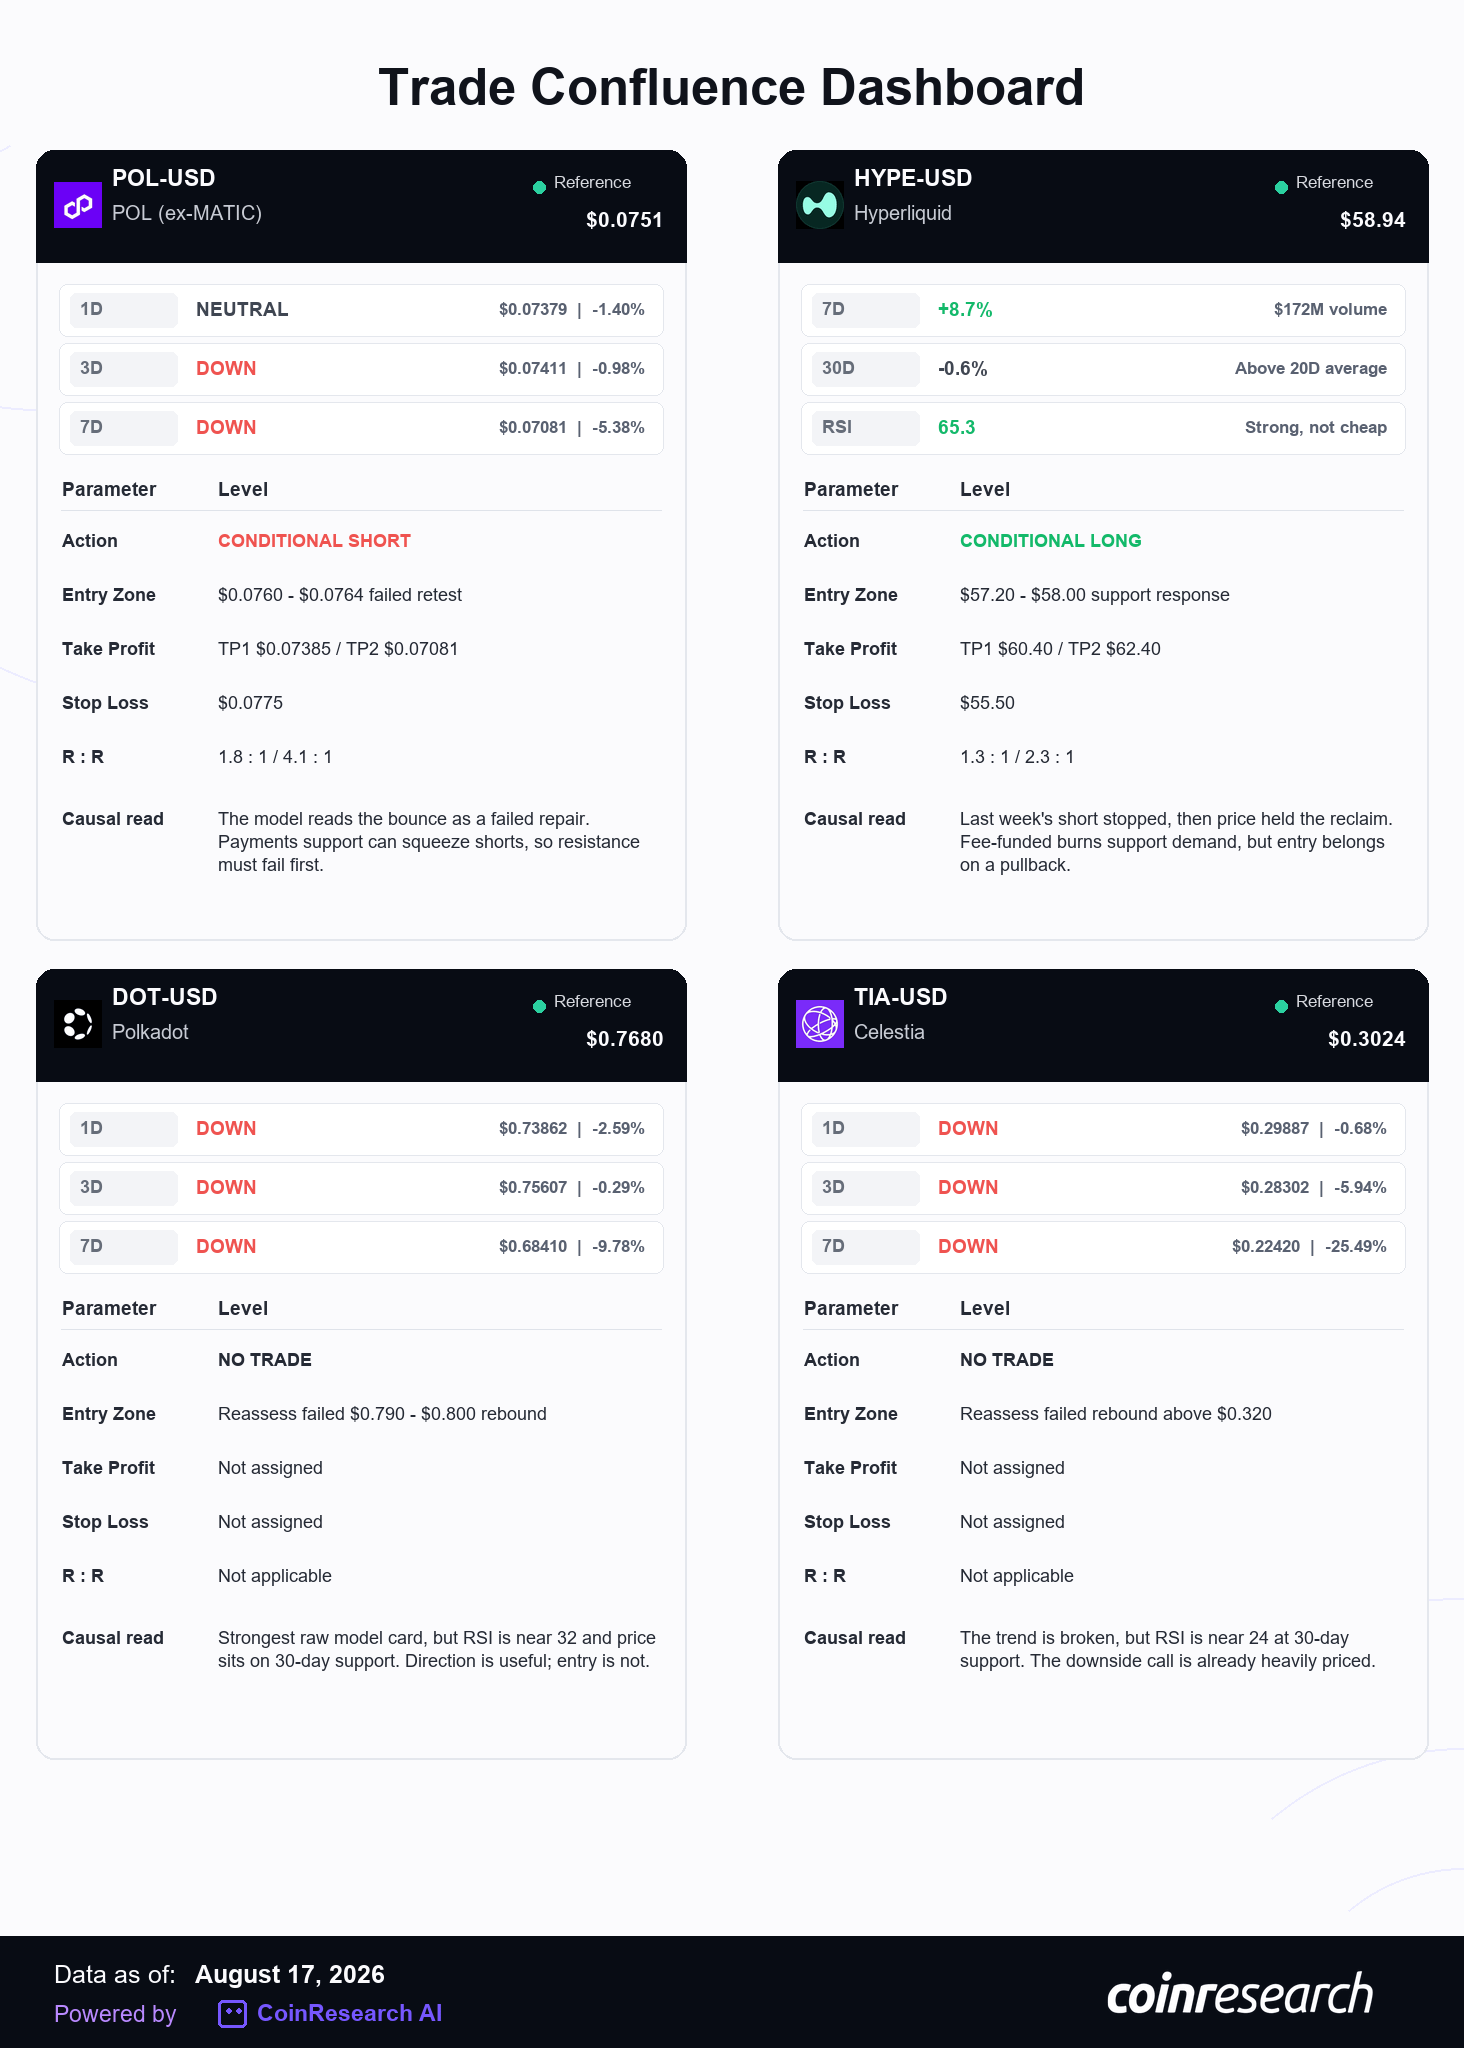
Market Confluence Analysis. The August 17 model is neutral over one day, then turns down over three and seven days. Its seven-day target is $0.07081 with 65.1% confidence. The likely cause is visible in the tape: POL sits below its 50-day average, the one-month trend remains negative, and the latest bounce has stalled under the $0.0760-$0.0764 resistance area. The forecast is treating that bounce as a failed repair rather than the start of a new trend.
We agree with the bearish direction, but not with shorting the current price. POL is close to local support, and Polygon still has a credible payments narrative after the Ithaca upgrade and recent stablecoin integrations. Those fundamentals can create a squeeze without changing the broader chart. Last week’s $0.0795-$0.0805 entry never traded, so the call expired without activation. This week’s setup uses a lower resistance zone and still needs sellers to prove control.
Trade Action.
-
Action: Conditional Short after a failed retest.
-
Entry Zone: $0.0760-$0.0764. Require rejection and a close back below $0.0760.
-
Take Profit: TP1 $0.07385. TP2 $0.07081.
-
Stop Loss: $0.0775.
-
R:R: Approximately 1.8:1 to TP1 and 4.1:1 to TP2 from the midpoint.
-
Rationale: The model’s bearish three- and seven-day direction matches a weak one-month structure, but selling current support would give away the entry edge.
-
Invalidation: Acceptance above $0.0775 would repair the failed-retest structure and cancel the short.
Analyst Note. The model gives us direction. The chart decides whether the direction is tradable. POL is the cleaner model-backed short only if resistance fails first.
Verdict: CONDITIONAL SHORT, wait for a failed $0.0760-$0.0764 retest.
HYPE-USD (Hyperliquid)
Reference Price: $58.94
Market Confluence Analysis. HYPE is our independent analyst setup. It gained roughly 8.7% over the latest seven-day live window, reclaimed its 20-day average, and pushed daily RSI into the mid-60s. The cause is not only momentum. Hyperliquid routes trading fees to community mechanisms, and its assistance fund automatically converts part of those fees into HYPE that is treated as burned. Active trading therefore creates recurring token demand.
Our view changed because the market changed. Last week’s short triggered, then stopped at $57.80 before price extended higher. That stop was useful information: sellers failed at the exact level that was supposed to cap the bounce. The bullish case now has both a structural reclaim and a live demand mechanism behind it. Still, HYPE is pressing toward its 50-day average and should not be bought at $59. The trade needs a pullback that holds above the reclaimed zone.
Trade Action.
-
Action: Conditional Long on a confirmed support response.
-
Entry Zone: $57.20-$58.00. Require a sweep-and-reclaim or a higher low inside the zone.
-
Take Profit: TP1 $60.40. TP2 $62.40.
-
Stop Loss: $55.50.
-
R:R: Approximately 1.3:1 to TP1 and 2.3:1 to TP2 from the midpoint.
-
Rationale: The prior bearish thesis was invalidated, price reclaimed its short-term trend, and fee-funded HYPE demand supports the move. The entry still has to come on a pullback.
-
Invalidation: A close below $55.50 would lose the reclaimed structure and show that the breakout failed.
Analyst Note. Flipping a view after a stop is not inconsistency. Keeping the old view after the market disproves it is. HYPE is long only on support, not at the current high.
Verdict: CONDITIONAL LONG, buy a confirmed $57.20-$58.00 support response.
DOT-USD (Polkadot)
Reference Price: $0.7680
Market Confluence Analysis. DOT is the strongest raw directional card in the August 17 run. The model points down across one, three, and seven days, with the seven-day signal carrying 84.5% confidence and a target near $0.68410. The likely cause is straightforward: price remains below its 20-day and 50-day averages, the rolling regression slope is negative, and DOT has failed to build relative strength while the broader market weakened.
We do not think that makes it a good short here. Daily RSI is near 32, price is sitting close to its 30-day low around $0.758, and social positioning is still heavily bullish. That combination creates bad geometry: the model may be directionally right, but a fresh short would be selling support with squeeze risk overhead. DOT also stopped a bearish call two editions ago. A repeat requires a new failed rebound, not the same forecast at a lower price.
Trade Action.
-
Action: No Trade.
-
Entry Zone: None at current price. Reassess only after a failed rebound toward $0.790-$0.800.
-
Take Profit: Not assigned.
-
Stop Loss: Not assigned.
-
R:R: Not applicable.
-
Rationale: The model is strong, but the entry is weak. Oversold momentum and nearby support leave too little room before squeeze risk dominates.
-
Invalidation: A clean reclaim of $0.800 would weaken the bearish model read. A failed rebound into that band could create a new setup.
Analyst Note. This is the clearest example of why model rank is not trade rank. The forecast is useful; the current entry is not.
Verdict: NO TRADE, wait for a failed rebound away from support.
TIA-USD (Celestia)
Reference Price: $0.3024
Market Confluence Analysis. The model is bearish over three and seven days, with directional history near 70% on both horizons and a seven-day target around $0.22420. The visible cause is a broken trend. TIA trades below its 20-day and 50-day averages, lost roughly 6.9% over the latest seven-day live window, and sits near the bottom of its 30-day range. Continuous token unlocks and declining inflation do not cancel the near-term supply overhang.
We agree that the structure is weak. We do not agree with pressing a short into it. Daily RSI is near 24, price is already testing the $0.300-$0.303 support area, and social sentiment remains roughly 80% bullish. A weak asset can keep falling while oversold, but the entry now depends on catching the final leg without being squeezed first. The model’s downside target is large because the trend is damaged. That same damage is why the trade is late.
Trade Action.
-
Action: No Trade.
-
Entry Zone: None at current price. Reassess after a relief bounce and failed reclaim above $0.320.
-
Take Profit: Not assigned.
-
Stop Loss: Not assigned.
-
R:R: Not applicable.
-
Rationale: Bearish model evidence is already reflected in an oversold chart sitting on 30-day support.
-
Invalidation: A sustained reclaim above $0.330 would show that the downtrend is repairing. A weak bounce that fails below it may create a later short.
Analyst Note. TIA can reach the model target without offering a responsible entry today. We are not paid for agreeing with a forecast; we are paid for choosing where the risk makes sense.
Verdict: NO TRADE, do not short an oversold test of support.
6. Token Launch & Ecosystem Radar
This week’s radar focuses on projects with official launch preparation rather than rumor-driven calendars.
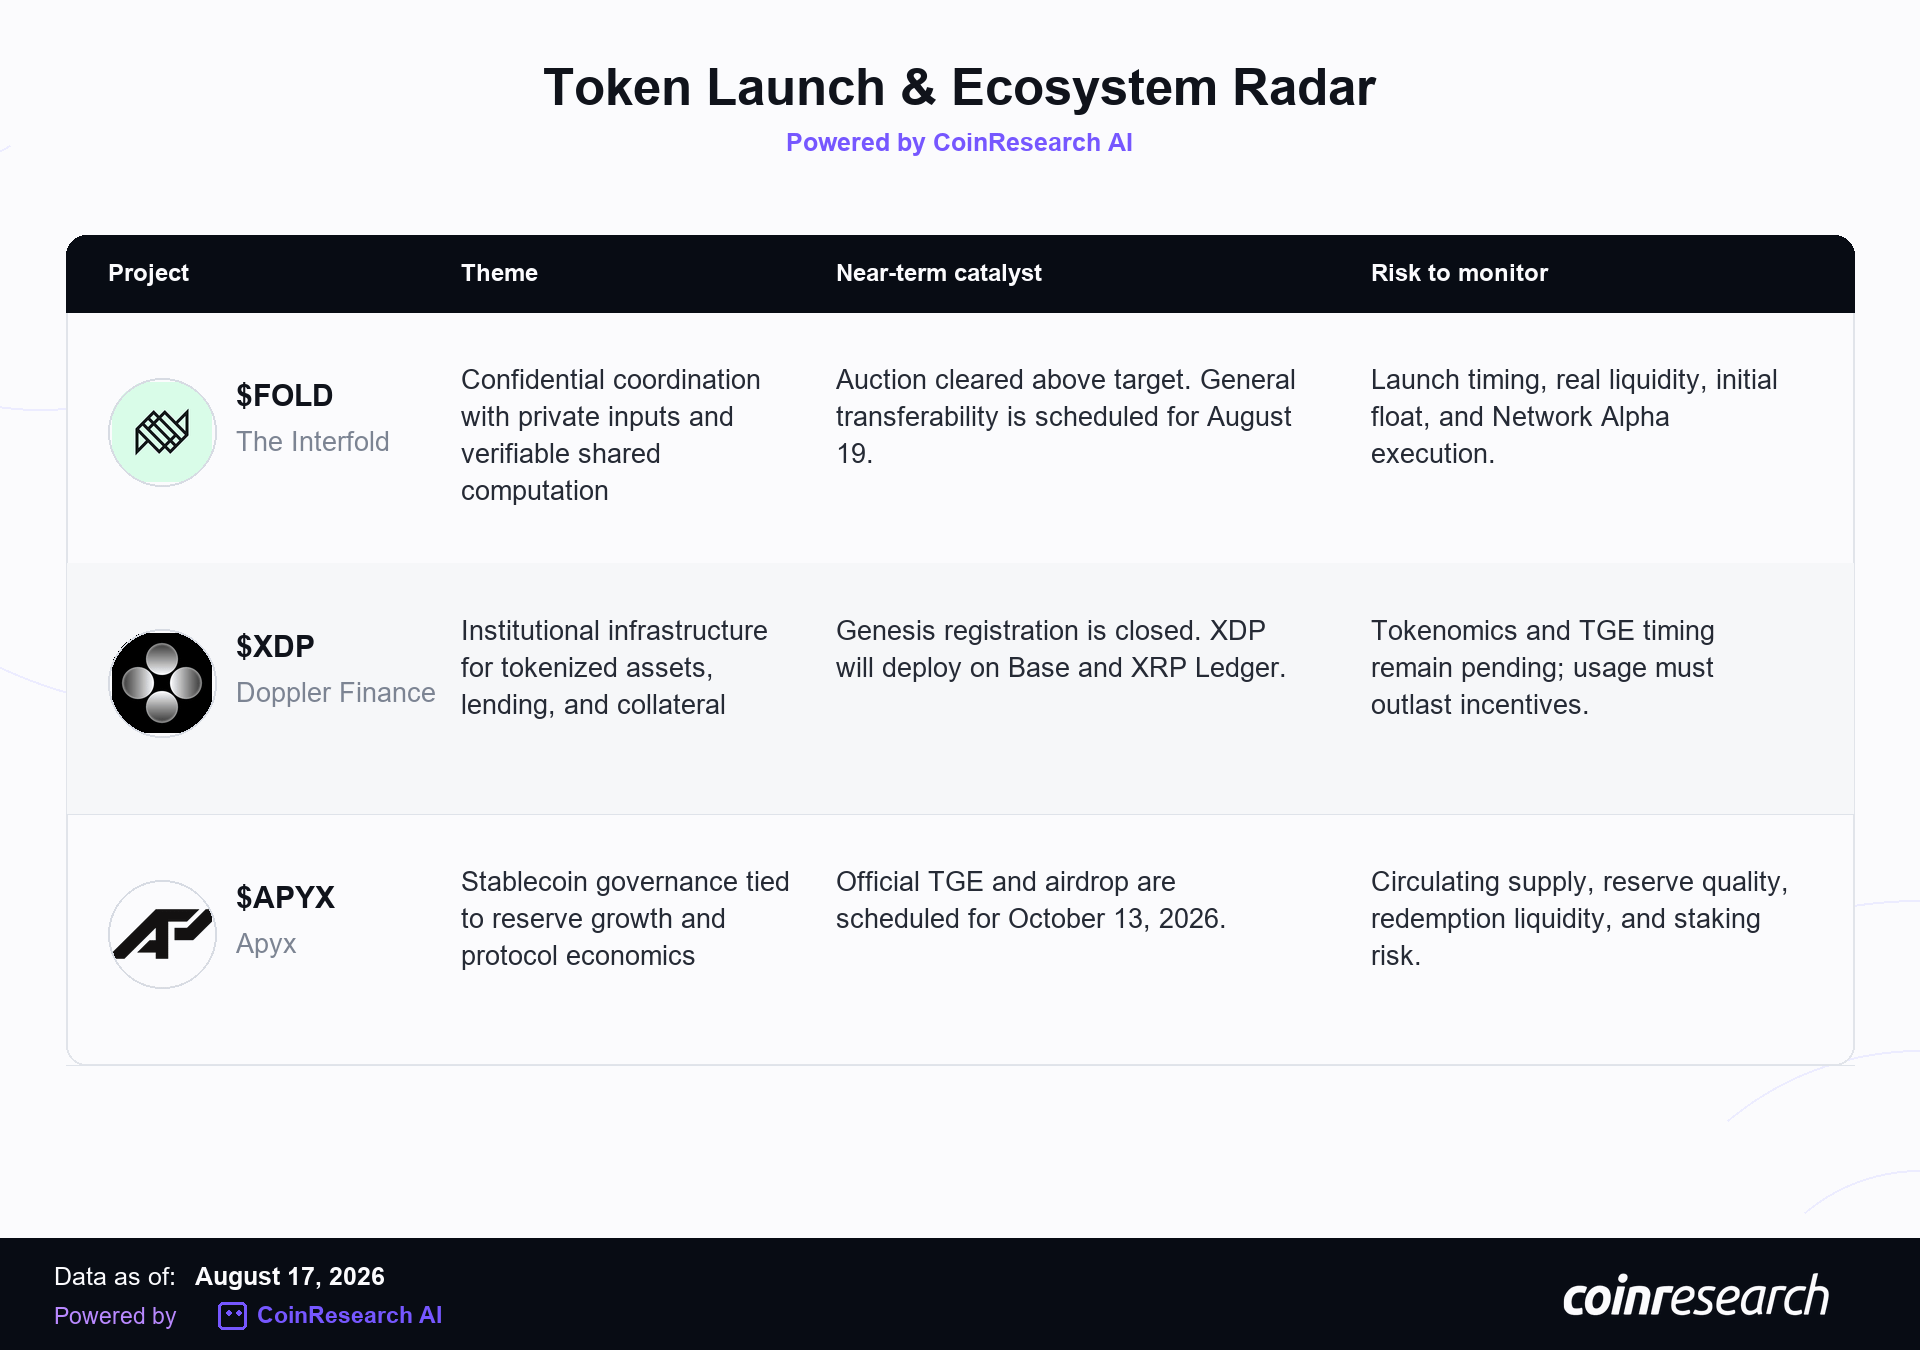
The Interfold ($FOLD) – a distributed network for confidential coordination across parties that need private inputs and verifiable shared computation.
-
Why watch it: The FOLD auction settled above its 400 ETH target, and the official launch sequence separates the auction, token transferability, and Network Alpha. That staged structure gives us specific milestones instead of a vague launch promise.
-
Current Status: Post-auction, pre-transferability. General FOLD transfers are scheduled for August 19, 2026, subject to official sale terms. The token was not openly transferable in the current check.
-
Monitoring Rationale: Watch whether transferability arrives on schedule, where real liquidity forms, how much of the projected float reaches the market, and whether ciphernode bonding develops before Network Alpha.
Doppler Finance ($XDP) – institutional onchain infrastructure for tokenized assets, lending, liquidity, and collateral markets.
-
Why watch it: Doppler closed its points program, completed Genesis Airdrop registration, and confirmed that XDP will launch across Base and XRP Ledger, with governance beginning on Base. The project also has active vault products and institutional partnerships rather than a token-only roadmap.
-
Current Status: Pre-TGE. Registration has closed, but official tokenomics, allocation details, claim timing, and the TGE schedule remain pending. No live CoinGecko market was found in the current check.
-
Monitoring Rationale: Track final supply and float, the claim contract, Base liquidity, XRP Ledger deployment, and whether institutional integrations generate repeat usage after incentives begin.
Apyx ($APYX) – a stablecoin protocol whose governance design links reserve growth and protocol economics to token participation.
-
Why watch it: Apyx has published a concrete TGE date and increased the Season 2 allocation to 6 million APYX. The token thesis is tied to reserve growth and governance rather than a last-minute exchange campaign.
-
Current Status: Pre-TGE. The official TGE and airdrop are scheduled for October 13, 2026. No live CoinGecko market was found in the current check.
-
Monitoring Rationale: Watch the final circulating supply, reserve composition, redemption liquidity, staking mechanics, and whether protocol revenue can support incentives without hiding risk in the reserve balance sheet.
7. Strategic Recap & Forward Outlook
The week answered last edition’s question. ETF demand did not survive the inflation data. Flows reversed, BTC and ETH closed lower, and sentiment stayed in Fear even as headline inflation cooled. The market did produce pockets of strength, especially HYPE and LINK, but they were exceptions rather than evidence of broad risk appetite. Good news removed an obstacle. It did not supply a buyer.
Forward Outlook – Week of August 17-23, 2026
-
Macro Watch. July import and export prices, housing starts, and industrial production arrive Tuesday, August 18. Minutes from the Federal Reserve’s July 28-29 meeting follow Wednesday, August 19 at 2:00 p.m. ET. Thursday brings weekly jobless claims and the Census advance services report. The minutes matter most if they confirm how divided the committee was after its 9-3 decision to hold rates at 3.50%-3.75%.
-
BTC Key Levels. Immediate support sits near the $62,500 weekly low, followed by $60,000. Resistance begins around $64,900-$65,250. A reclaim would show that the ETF outflow week was absorbed. A daily close below $62,500 would expose the psychological $60,000 level.
-
Altcoin Outlook. HYPE and LINK proved that relative strength still exists, but ADA’s 9.81% decline and weakness in XRP and SOL show how selective the market remains. Favor names with live demand mechanisms and confirmed support. Avoid treating every oversold chart as value.
-
Model Portfolio Summary. POL is a conditional failed-retest short at $0.0760-$0.0764. HYPE is a conditional support-response long at $57.20-$58.00. DOT and TIA are no-trade cards until price moves away from support and gives a cleaner trigger. Two trades are enough. The other two forecasts remain useful as market diagnostics.
For full prediction dashboards, trade setups, and live forecast signals, visit
Disclaimer: CoinResearch Intelligence Weekly is published for educational and informational purposes only. Nothing in this newsletter constitutes financial advice. Cryptocurrency markets are highly volatile – past performance does not guarantee future results. Always conduct your own research and consult a qualified financial adviser before making investment decisions.