
Geopolitical Shock, Extreme Fear, and the 150-Day Countdown: Navigating War, Tariffs, and Macro Paralysis as Bitcoin Defends $63K | Week Ending March 1, 2026
The final week of February 2026 marked the moment geopolitics violently reasserted its influence on crypto. What started as quiet consolidation near $67,000 ended with coordinated U.S.-Israeli strikes on Iran that erased roughly $128 billion in market value in under an hour, sending Bitcoin to an intraday low near $63,000 before it recovered above $65,000.
The macro backdrop entering March is hostile: a Supreme Court ruling on emergency tariffs pushed President Trump to invoke Section 122 and lift global tariffs to 15% for 150 days, hotter PPI data has dampened hopes for near-term Fed cuts, and the Crypto Fear & Greed Index sits at 14 in deep “Extreme Fear” territory.
Even so, structural signals remain constructive. Bitcoin ETFs saw about $787 million in net inflows during the week, led by a single-day spike of more than $500 million, Strategy completed its 100th BTC purchase to reach over 717,000 BTC, and the 150‑day tariff window sets up a potential narrative catalyst in May–June as markets begin to price in possible tariff expiry.

Strengths
-
ETF Inflows Reversed the Bleeding: After five consecutive weeks of outflows totaling $3.8 billion, spot Bitcoin ETFs snapped the streak with $787 million in net inflows during the week, anchored by BlackRock’s IBIT and Fidelity’s FBTC. This suggests tactical institutional re-entry rather than panic accumulation, a meaningful distinction.
-
Corporate Treasury Conviction Deepens: Strategy’s 100th BTC purchase (592 BTC at $67,286 average) and BitMine’s expansion to 4.4 million ETH signal that the corporate treasury thesis remains intact despite a 52%+ BTC drawdown from all-time highs.
-
150-Day Tariff Clock as Built-In Catalyst: Section 122 tariffs expire automatically around July 20, 2026, without congressional extension. As that deadline approaches, the expected tariff rate declines, a forward-looking bullish input for risk assets starting May–June.
Weaknesses
-
Geopolitical Escalation Is Unpriced and Ongoing: The U.S.-Israel strikes on Iran, including the confirmed death of Ayatollah Khamenei, represent a material escalation that is not fully priced into markets. The real volatility test arrives Monday when U.S. equity markets and Bitcoin ETFs reopen, with Strait of Hormuz closure risk and Iranian retaliation still live scenarios.
-
Fear Index at Historic Extremes: The Crypto Fear & Greed Index at 14 extends the longest sustained “Extreme Fear” period since the index began, with February 2026 recording the lowest average monthly sentiment score ever, surpassing the FTX collapse, Terra/Luna, and the COVID crash.
-
Retail Abandoning Crypto for Equities: Wintermute data shows retail flows increasingly favoring equities over digital assets, with correlation between retail activity and altcoin market cap turning negative, effectively pulling capital away from crypto markets.
Market Recap
The week ending March 1, 2026, delivered violent two-way price action driven by macro headlines rather than crypto-native catalysts. Total crypto market capitalization fell to $2.19 trillion, with BTC dominance holding at 58.48%. The Feb 25 relief rally produced the sharpest single-day bounce of the month, coinciding with $588 million in short liquidations, before the Feb 28 Iran strike erased all gains and then some.
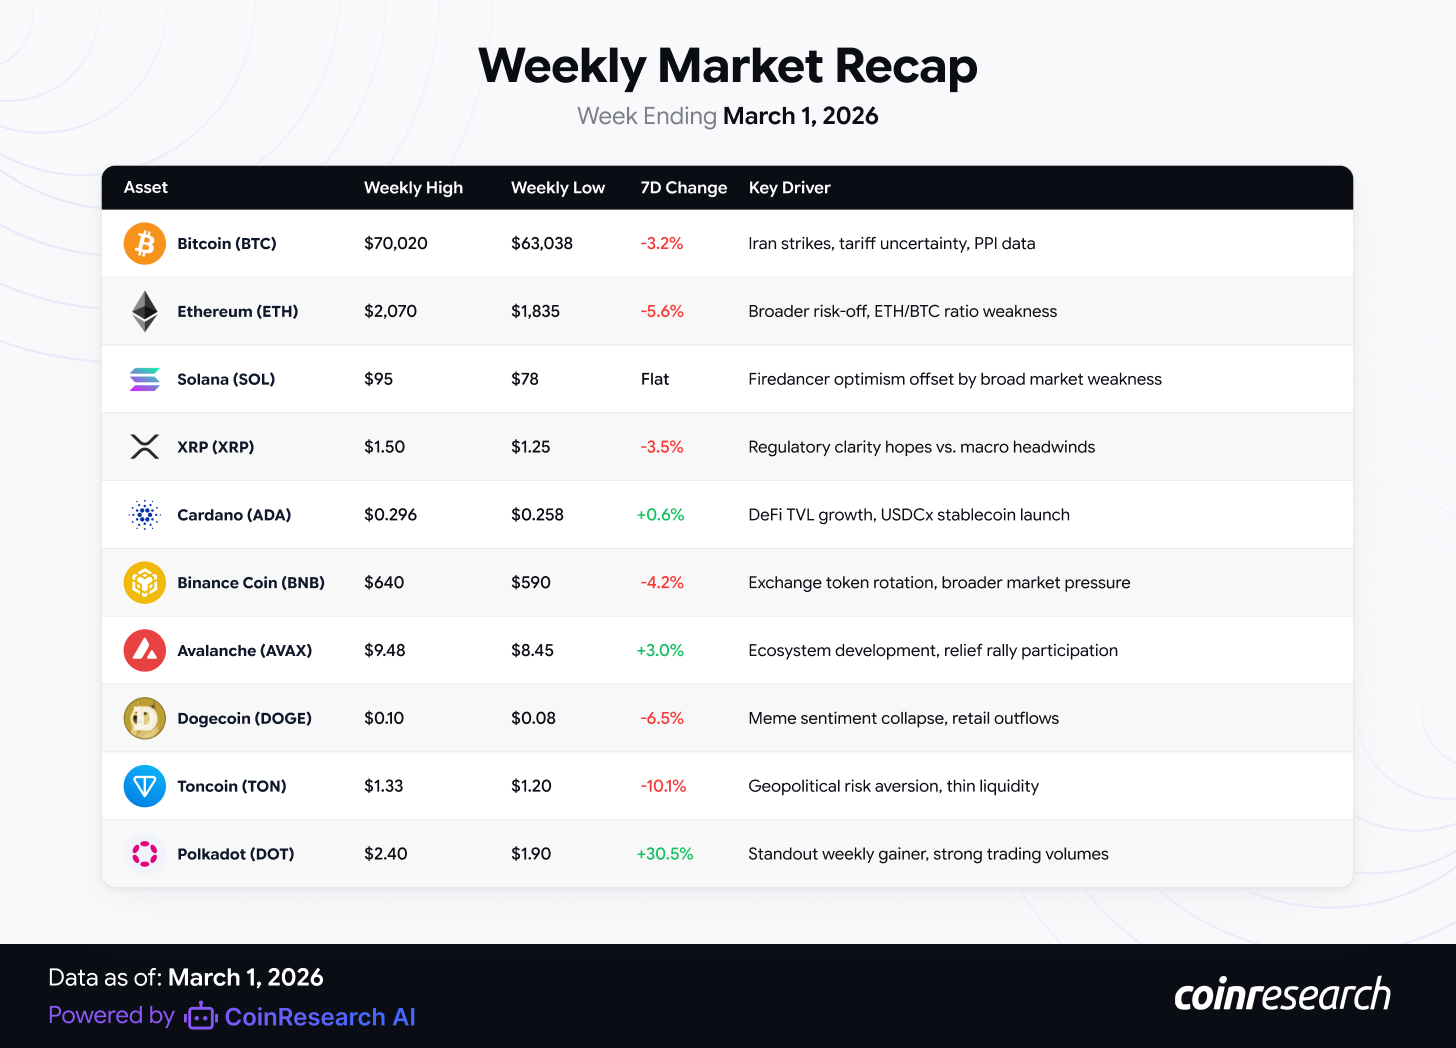
Sentiment: Extreme Fear (14/100). The Feb 25 relief rally briefly lifted sentiment, but the Feb 28 geopolitical shock immediately reset risk appetite to crisis levels. Cross-asset comparison shows the S&P 500 (+0.52%) and Nasdaq (+1.31%) outperforming crypto for the week, while gold surged 3.12% and silver 10.15%.
AI/ML Model Insight & Market Confluence
CoinResearch AI integrates the Price Prediction Machine-Learning with real-world technical indicators, sentiment data, and macro context.
Below are the latest model outputs for the week of March 2, 2026, cross-validated with market structure, momentum, and geopolitical risk assessment.
Disclaimer:
The insights and forecasts presented here are generated by CoinResearch AI’s predictive models and supporting analytics. They are provided for informational and educational purposes only and do not constitute financial advice or investment recommendations. Trading digital assets involves risk, and users should conduct their own research, exercise independent judgment, and use appropriate risk management before making any investment or trading decisions.
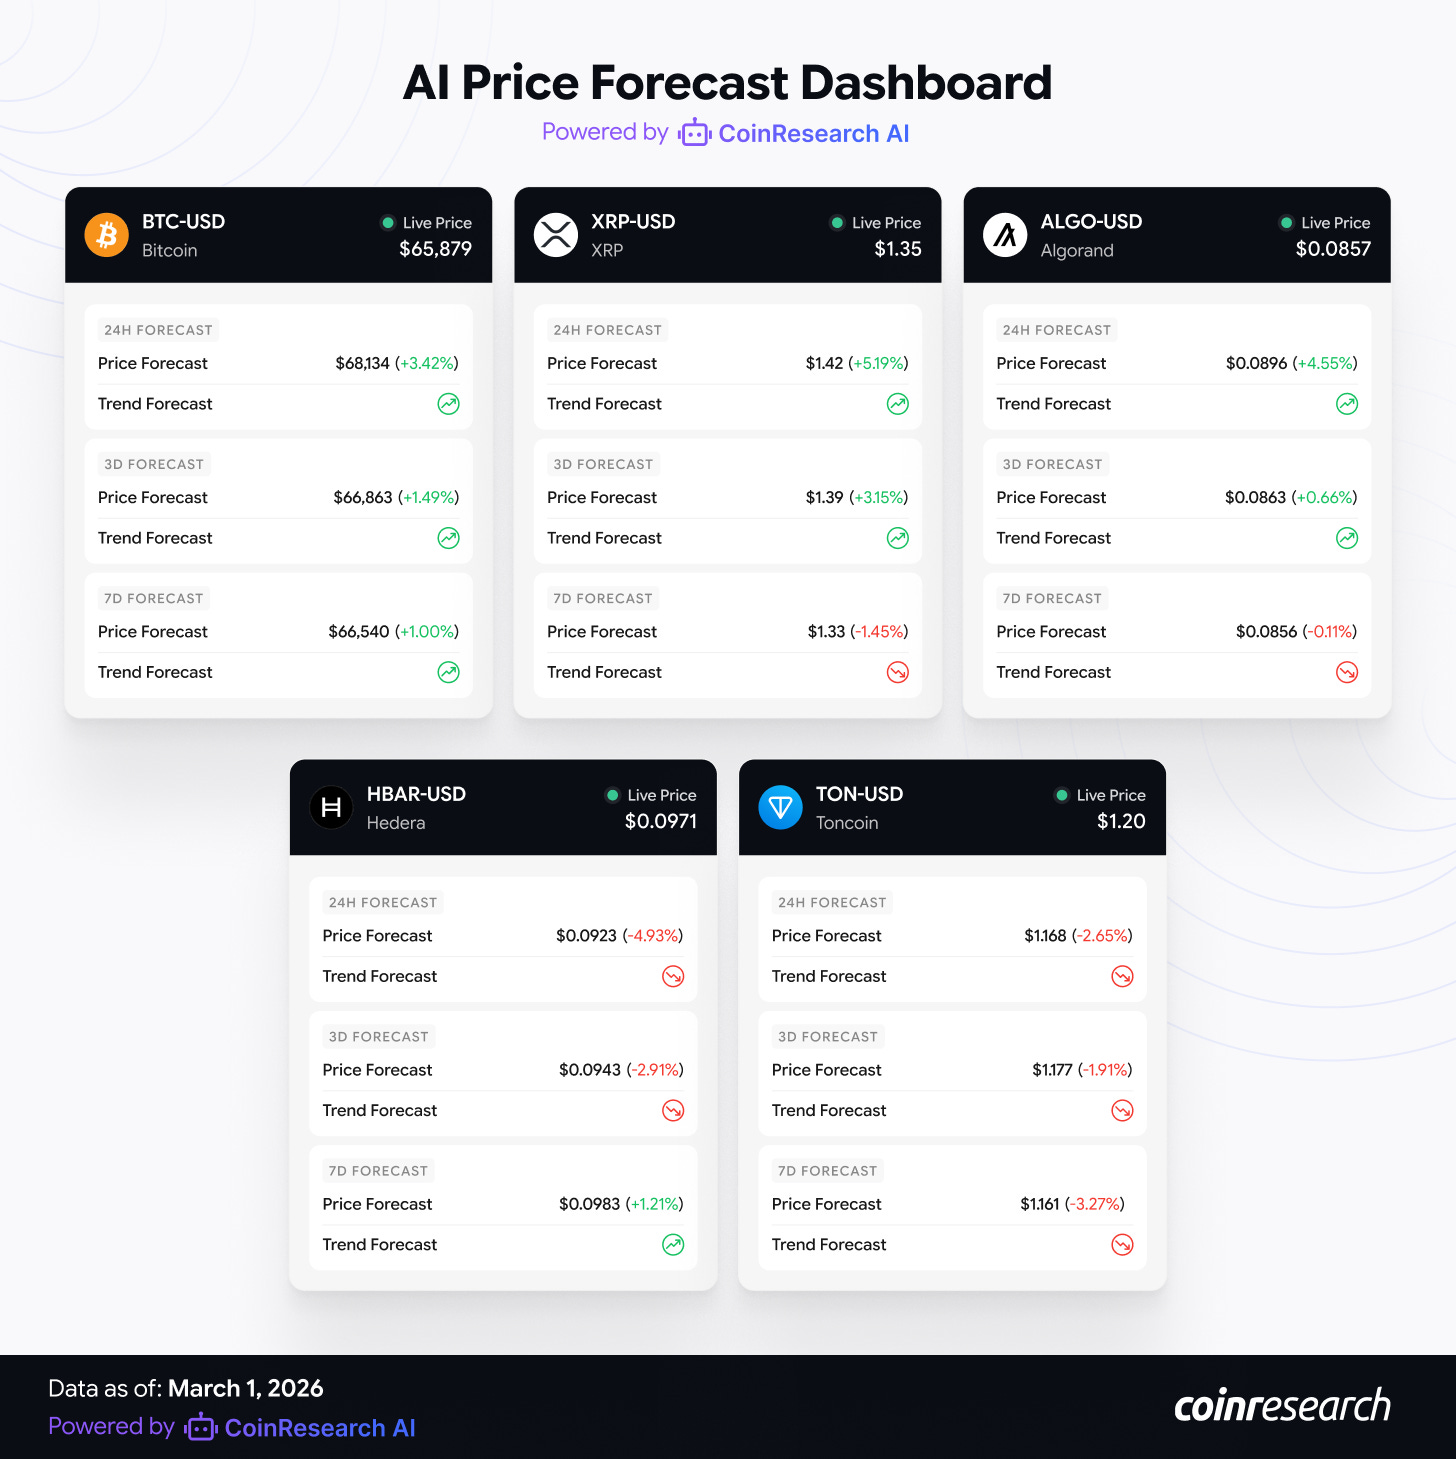
Bitcoin (BTC) | Reference Price: $65,879
Model outlook
-
1D : +3.42% → 68,134
-
3D : +1.49% → 66,863
-
7D : +1.00% → 66,540
The machine learning model points to a rebound toward the high 60,000s, then a slower grind that leaves BTC only slightly higher on a one week horizon. It is effectively pricing the Feb 28 flush as a shock that mean‑reverts, while acknowledging that upside is capped.
Context: BTC is trading inside a wide 63,000 to 70,000 band after an overnight liquidation spike triggered by the strikes on Iran. Funding is mildly negative, spot volumes are elevated, and daily RSI is closer to support than resistance. The structural line that matters is 60,000. A clean break below that level would turn a controlled reset into a full regime shift.
Trade Action: HOLD / Accumulate on Weakness
-
Preferred entry: 63,000 to 64,500
-
Take profit 1: 68,000
-
Take profit 2: 72,000
-
Stop loss: 59,500
Rationale: Across 1D, 3D, and 7D the model leans modestly higher, which fits an oversold market where forced sellers have already moved. The war and Hormuz risk make the path binary, so the play is not to chase strength near 70,000, but to layer bids closer to 63,000 with half‑size risk. BTC is the only asset here that justifies fresh exposure while the conflict is unresolved.
Invalidation
-
Daily close below 60,000
-
A renewed wave of large ETF outflows or a clear risk‑off shock in equities and credit
-
Material escalation in the conflict or credible signs of prolonged Hormuz disruption
XRP | Reference Price: $1.35
Model outlook
-
1D: +5.19% → 1.42
-
3D: +3.15% → 1.39
-
7D: −1.45% → 1.33
The profile is classic short‑term squeeze, then fade. The model sees room for an impulsive move into resistance, followed by drift back below current levels over a week.
Context: XRP sits in the middle of its recent range, with resistance near 1.50 to 1.60 and support around 1.25 to 1.30. Liquidity is better than smaller alts but far weaker than BTC. In an active war tape, capital tends to migrate away from secondary assets and back to majors.
Trade Action: HOLD, Tactical Not Structural
-
Preferred entry: 1.30 to 1.35
-
Take profit 1: 1.50
-
Take profit 2: 1.65
-
Stop loss: 1.22
Rationale: The model’s short‑term bullish bias can play out if there is a relief window, but the negative 7D projection is a reminder that any spike is likely to be sold into. Existing holders can justify a tactical hold with tight risk; fresh capital is better reserved for BTC until the macro picture is clearer.
Invalidation
-
Clean daily close below 1.22
-
BTC losing 60,000 and dragging altcoin liquidity lower
-
Adverse regulatory headlines that directly weaken the XRP thesis
Algorand (ALGO) | Reference Price: 0.0857
Model outlook
-
1D: +4.55% → 0.0896
-
3D: +0.66% → 0.0863
-
7D: −0.11% → 0.0856
ALGO shows a front‑loaded bounce followed by a flat to slightly negative week. The model is effectively saying that any strength in the next day or two is likely to be faded.
Context: ALGO has been structurally weak all cycle and does not have a clear, near‑term catalyst. Liquidity is thin, and in war‑driven risk‑off regimes these names are usually the first place traders pull risk from and the last place they re‑enter.
Trade Action: NO TRADE
Rationale: With 3D and 7D projections that round to flat, the model is not offering a high‑conviction edge here. In the current environment, playing for a marginal bounce in a mid‑cap without a strong fundamental trigger is poor use of risk. Capital is better concentrated in BTC.
Invalidation of the no‑trade stance
-
Clear ecosystem catalyst with real volume (major migration, blue‑chip DeFi launch)
-
Broad based altcoin rotation with sustained flows
-
BTC reclaiming and holding above 70,000 with improving sentiment
Hedera (HBAR) | Spot: 0.0971
Model outlook
-
1D: −4.93% → 0.0923
-
3D: −2.91% → 0.0943
-
7D: +1.21% → 0.0983
HBAR has a U‑shaped forecast: near‑term weakness over 1–3 days, then a modest recovery that leaves price just above spot after a week.
Context: HBAR is pressing against a local band of resistance and has already seen a decent run. In a fragile market, this is the type of chart where late longs get shaken out first when volatility spikes.
Trade Action: AVOID
Rationale: The model is effectively flagging a shakeout, then slow repair. That may tempt swing traders, but with geopolitics as the primary driver there is a high chance of getting stopped on the initial leg without ever capturing the later recovery. The risk‑reward does not beat simply waiting and redeploying into BTC if the market holds key levels.
Invalidation
-
Convincing reclaim and hold above 0.10 on strong volume
-
Clear, price‑moving news (large institutional deal, major network upgrade)
-
Shift in macro tone into obvious risk‑on, with BTC leading higher
Toncoin (TON) | Spot: 1.20
Model outlook
-
1D: −2.65% → 1.168
-
3D: −1.91% → 1.177
-
7D: −3.27% → 1.161
TON is the cleanest sustained downside in the set. All three horizons lean lower, pointing to a grind rather than a one‑off flush.
Context: Price has already corrected about ten percent from recent highs. Order books are thinner than for large caps, and there are no obvious short‑term catalysts. In a conflict‑driven tape, this is the kind of asset that can keep leaking lower without much two‑way flow.
Trade Action: NO TRADE
Rationale: With the model aligned to the downside across 1D, 3D, and 7D, and with macro risk elevated, staying flat is the highest‑quality decision. Shorting after a double‑digit drop is not attractive, and buying into a projected downtrend is fighting both the model and the tape.
Invalidation
-
High‑timeframe reversal backed by strong spot buying
-
Concrete positive catalyst (tokenomics change, major partnership, clear narrative upgrade)
-
Evidence of a broad altcoin rotation where TON participates with real volume
Cross‑Asset Takeaways
The models are sending a consistent message for a war‑driven market: BTC is the only asset where modest upside is projected across all horizons, while altcoins either show temporary bounces that fade or outright grinding downside. In this regime the right bias is capital preservation, selective BTC accumulation near support, and a high bar for any new altcoin risk.
This framing matches how BTC reacted to the strikes, sliding to the low 60,000s before rebounding, and how sentiment has remained locked in extreme fear since the Middle East escalation began.
Note: This dashboard presents a snapshot of 5 sample forecasts from CoinResearch AI’s predictive models. The full version includes over 100 continuously updated AI-driven forecasts, accessible to users directly on our platform starting from $9/mo.
Token Launch & Ecosystem Radar
A curated look at three high-signal projects approaching major milestones that have not yet launched their tokens. Each combines strong backers, transparent development, and real execution momentum.
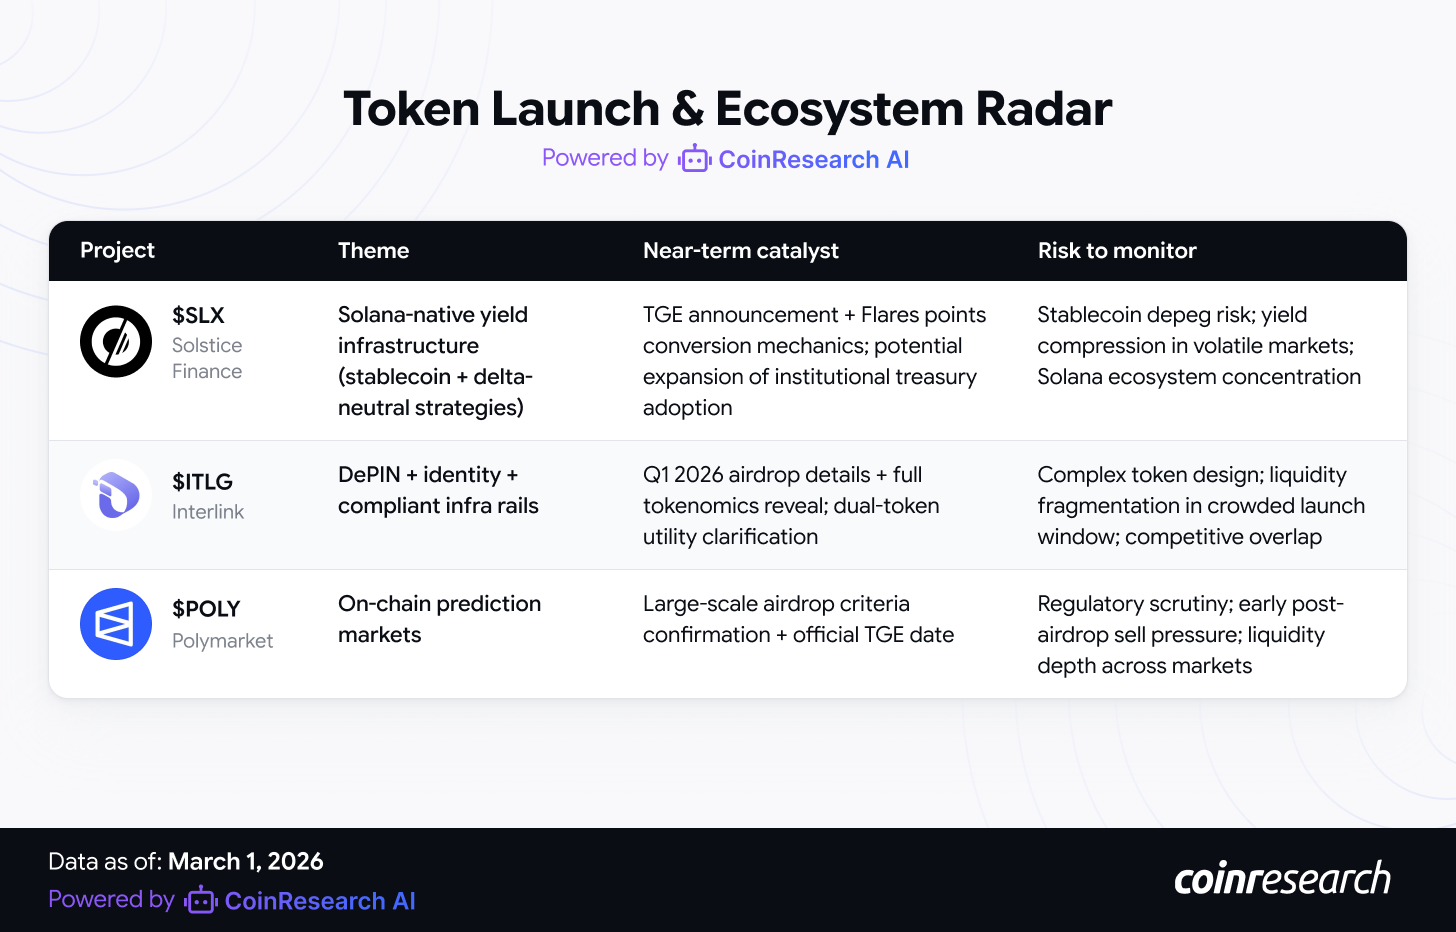
Solstice Finance (SLX) | Solana-Native Yield Infrastructure
Status: Token generation event (TGE) pending; Flares points program active
Thesis: Solstice is the yield infrastructure layer for Solana, offering USX (the largest Solana-native stablecoin) and eUSX (a yield-bearing token) powered by delta-neutral strategies including funding rate arbitrage, hedged staking, and tokenized U.S. Treasury bills. The protocol manages approximately $300 million in TVL across 24,000+ holders as of January 2026. Backed by Deus X Capital ($1B AUM), Galaxy Digital, MEV Capital, and Bitcoin Suisse, Solstice is not a speculative bet, it is institutional infrastructure already generating real yield.[27]
Why Monitor: The first Nasdaq-listed company (DeFi Development Corp, DFDV) has already adopted Solstice’s YieldVault for corporate treasury management, validating institutional demand. The SLX governance token, distributed through the Flares points program, represents a governance layer over $300M+ in TVL, a rare opportunity to gain exposure to yield infrastructure before the token enters broader circulation. In a bear market environment where capital seeks non-directional yield, Solstice addresses a genuine market need.[27]
Risk: Synthetic stablecoin depegging risk; delta-neutral strategies can underperform in extreme volatility; Solana ecosystem concentration risk.
Interlink (ITLG) | DePIN + Identity Infrastructure
Status: Airdrop and TGE scheduled for Q1 2026; tokenomics reveal ongoing.
Thesis:
Interlink positions itself at the intersection of decentralized physical infrastructure (DePIN) and identity. It is designing a dual‑token model where one asset secures the network and another powers identity and data‑access layers, targeting use cases that span compliant stablecoin rails, machine data, and cross‑chain identity.
Why Monitor:
The project is already on the radar of both DePIN and identity communities, with Q1 2026 airdrop details sparking renewed interest as more information about the dual‑token economy comes out. In a cycle where regulation and real‑world integration matter more than speculative farming, an infra project that blends physical networks with identity and compliance tooling has asymmetric upside if it executes.
Key Risks:
Complex token design, potential overlap with both pure DePIN and pure identity competitors, and the risk that a crowded Q1 2026 launch calendar fragments attention and liquidity.
Polymarket (POLY) | On‑Chain Prediction Market
Status: Large‑scale airdrop and token launch planned for early 2026; exact date and criteria pending.
Thesis:
Polymarket is one of the dominant on‑chain prediction markets, allowing users to trade event outcomes across politics, macro, crypto, and sports. The platform reportedly facilitated over two billion dollars of volume in 2025 and has raised significant funding to scale. The planned POLY token airdrop, estimated at around 750 million dollars in value, is designed to deepen liquidity and align users with protocol growth.
Why Monitor:
Prediction markets sit at the intersection of information, trading, and governance. If the regulatory environment continues to move toward more clarity and tokenized betting gains mainstream mindshare, Polymarket is positioned to be the category leader. A large, clearly signaled airdrop to active users and LPs makes this one of the most important “earn your allocation before TGE” opportunities in early 2026.
Key Risks:
Regulatory risk around prediction markets and real‑money event contracts, execution risk in scaling liquidity across many markets, and the possibility that the size of the airdrop creates heavy early selling pressure if not managed carefully.
Strategic Recap & Forward Outlook
The week ending March 1, 2026, marks a new phase in this bear cycle: the intersection of geopolitical war risk with already-extreme fear sentiment. The U.S.-Israel strikes on Iran have introduced a variable that transcends normal crypto market analysis, this is a macro-geopolitical event with potential cascading effects on oil prices, dollar strength, Fed policy, and global risk appetite.
Key Takeaways:
-
The Iran situation is the dominant variable for the next 1–2 weeks. Until the military operation concludes and Iranian retaliation risk is assessed, all technical and model-based analysis carries reduced predictive power. Position sizing should reflect this uncertainty, half-size positions maximum.
-
ETF flows are the leading indicator for institutional sentiment. The mid-week reversal to $787M in inflows was a genuinely constructive signal, but Monday’s ETF reaction to the Iran strikes will determine whether this was a one-week reprieve or a genuine trend change.
-
The 150-day tariff clock creates a structural catalyst window. Markets are forward-looking. As the July 20 Section 122 expiration approaches without congressional extension (politically treacherous in a midterm year), the expected tariff rate declines, stimulative for risk assets. The May–June window is where this narrative begins to price in.
-
Extreme Fear at historic levels is a contrarian signal, but timing matters. The lowest monthly average Fear & Greed score ever recorded (surpassing FTX and COVID) indicates sentiment capitulation has occurred. Historically, such extremes precede multi-month recoveries. However, the presence of live geopolitical conflict means the capitulation may not be complete.
-
Altcoins remain fragile and should be avoided for new positions. Retail capital is flowing to equities, not crypto. Mid-cap and small-cap altcoins face thin liquidity and amplified downside risk. Capital should concentrate in BTC and, selectively, ETH until risk appetite demonstrably returns.
Forward Outlook (Week Ending March 8, 2026):
The base case for the coming week is elevated volatility with a slight bearish bias, driven primarily by the Monday equity and ETF market reaction to the Iran strikes. Bitcoin is likely to test the $60,000–$63,000 support zone before any meaningful recovery attempt. A hold above $60,000 would confirm the floor established during the February capitulation events; a break below opens the path toward $55,000.[23]
Key catalysts for the week ahead:
-
Monday March 3: U.S. equity and ETF market reopening, the first institutional reaction to the Iran strikes. This is the single most important session of the week.
-
Thursday March 6: U.S. unemployment data release, labor market health affects Fed calculus for the March 18 decision.
-
Ongoing: Iran conflict developments, Strait of Hormuz shipping risk, oil price dynamics.
-
Structural: CLARITY Act legislative progress, FTX fund distribution timeline.
Risk Context: Current market structure is fragile at every level. Leverage is already flushed (funding rates negative), fear is at historic extremes, and ETF flows are the only institutional lifeline. The geopolitical overlay adds a variable that cannot be modeled or predicted. This is not a market for aggressive positioning in either direction, it is a market for patience, capital preservation, and selective accumulation at structural support levels.
Disclaimer: This analysis is for informational purposes only and should not be construed as investment advice. Cryptocurrency markets carry substantial risk, including the potential loss of principal. Past performance does not guarantee future results. Always conduct your own due diligence and consult a qualified financial advisor before making investment decisions.