
Hawkish Fed Minutes, Fresh Tariffs, and a Sunday Night Flash Crash: Bitcoin’s Structural Floor Tested Again | Week Ending February 22, 2026
The third full week of February 2026 stripped away whatever tentative optimism the prior week’s CPI-driven bounce had generated. Bitcoin entered the week consolidating around $68,800 and exited it in freefall,crashing below $65,000 on Sunday evening in a violent two-hour, 5% liquidation cascade that erased the entire range established over the previous ten days. The week’s defining macro event was the release of the January FOMC meeting minutes on Wednesday, February 18, which delivered a hawkish surprise: several Fed members explicitly acknowledged that rate hikes could be appropriate if inflation remains above target,a stark departure from the dovish tone the market had been pricing after the cooler January CPI print. Compounding the damage, President Trump’s decision to raise global tariffs from 10% to 15% following a Supreme Court ruling injected fresh geopolitical risk into an already fragile market. Bitcoin ETF flows continued their relentless negative streak, with cumulative outflows of approximately $374–$392 million across the February 17–19 window alone, led by IBIT shedding $119.7M on Monday, $84.2M on Tuesday, and $158.9M on Wednesday. The Fear & Greed Index remains anchored at 9,deep in Extreme Fear territory for what is now the eighth consecutive week, the longest such streak since the 2022 bear market.

Strengths
-
CPI tailwind still lingers beneath the surface. While this week’s price action was unequivocally bearish, the macro backdrop has not deteriorated at the fundamental level. January’s 2.4% headline CPI and 2.5% core CPI remain the most encouraging inflation readings in months, and the disinflation trajectory is intact even as the Fed’s rhetoric has turned more cautious. The market is digesting the pace of easing, not a reversal of the trend.
-
Institutional conviction pockets remain. Despite the broad ETF outflow picture, notable institutional buyers continue to accumulate. Strategy (formerly MicroStrategy) purchased an additional 2,486 BTC for $168.4 million last week, bringing total holdings to 717,131 BTC. Abu Dhabi’s Mubadala Investment Company increased its IBIT stake to 12.7 million shares worth approximately $630 million,up 46% from the prior quarter. These are not the actions of institutions exiting the asset class.
-
Regulatory clarity accelerating. Under Chair Paul Atkins, the SEC has dismissed or closed more than a dozen major crypto-related cases, including parts of the litigation against Binance and Coinbase, signaling a definitive end to the era of “regulation by enforcement”. The SEC/CFTC “Project Crypto” unified framework and the impending SEC decision on a spot XRP ETF (expected February 26) represent meaningful structural positives that transcend short-term price action.
Weaknesses
-
FOMC minutes introduced rate hike risk back into the conversation. The January meeting minutes revealed growing division among Fed policymakers, with “several” officials indicating that rate hikes could be warranted if sticky inflation persists. This nuance dramatically widens the policy range and tempers confidence around mid-year easing, keeping risk assets,and especially purely speculative ones like crypto,in consolidation mode at best, liquidation mode at worst.
-
Bitcoin ETF outflow streak shows no sign of abating. The February 17–19 window produced cumulative outflows exceeding $374 million, with IBIT leading every single session. This marks the third consecutive week of significant net negative flows, following the $121 million outflow the prior week and the catastrophic $938 million two-day hemorrhage during the February 4–5 capitulation. The absence of even a single day of meaningful net inflows this week eliminates the “rotation, not exit” thesis that briefly gained traction.
-
Sunday night flash crash exposes structural fragility. Bitcoin’s 5% drop in two hours on Sunday evening,from $67,600 to below $65,000,was driven by whale-dominated exchange inflows. CryptoQuant data shows the exchange whale ratio surged to 0.64, the highest level since 2015, while the average deposit size climbed to 1.58 BTC (the highest since June 2022). This is active distribution by large holders into thin weekend liquidity,a textbook sign of capitulation acceleration, not its conclusion. Bitcoin has now recorded six consecutive negative weekly closes, six straight closes below its 100-week moving average, and three consecutive closes beneath its 2021 high.
Market Recap
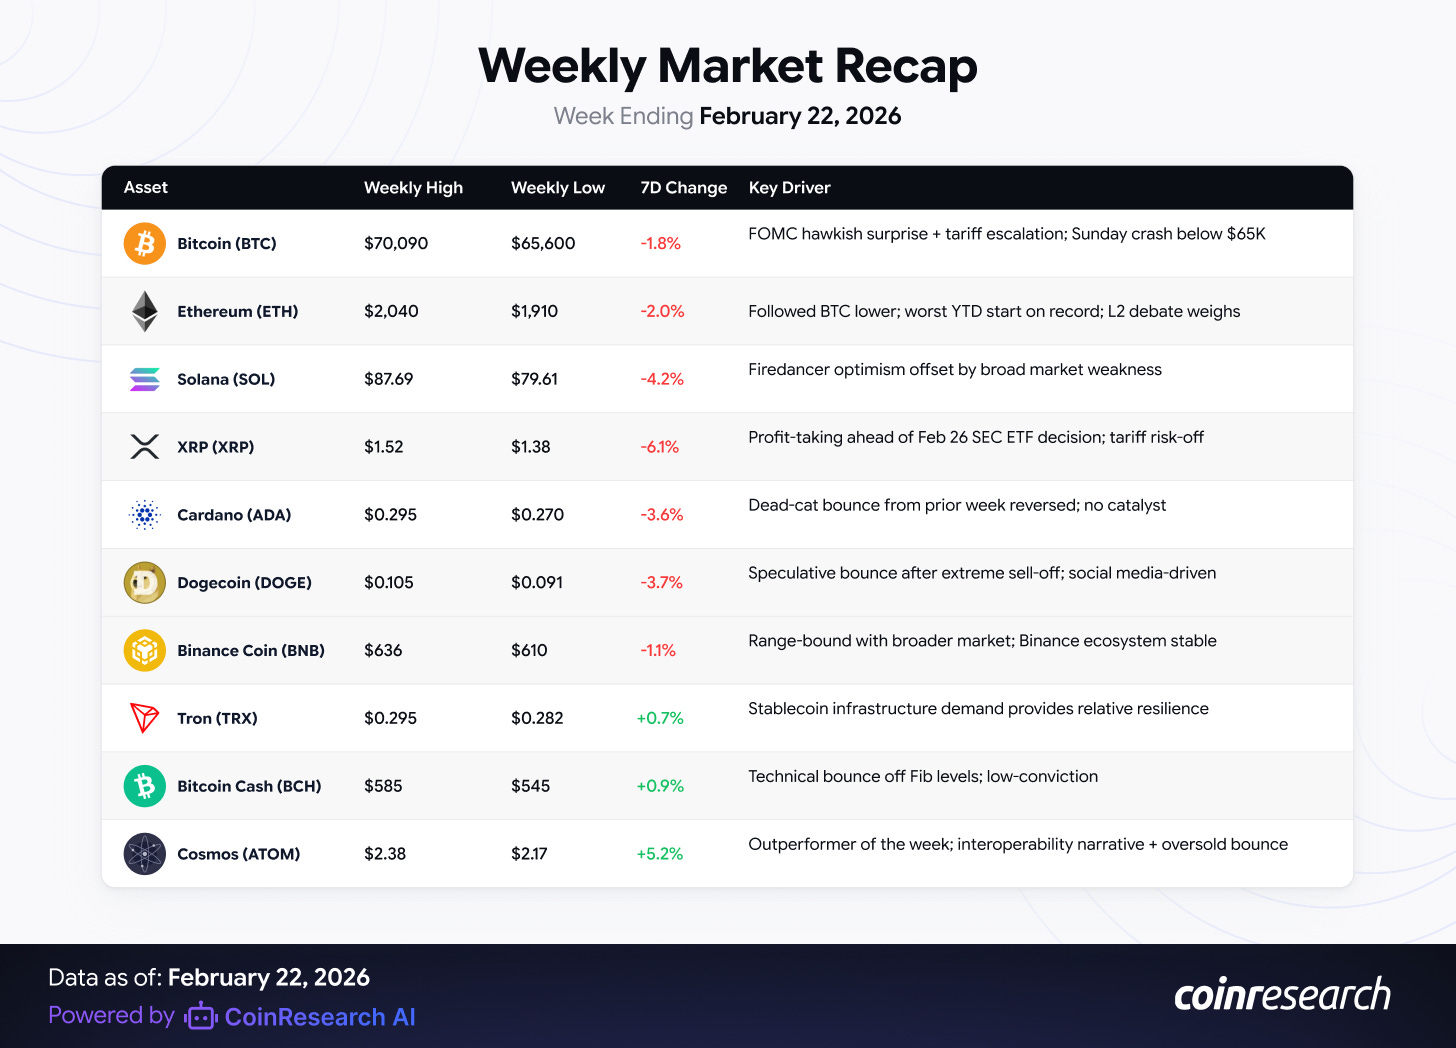
Overall Market Sentiment: Extreme Fear (Fear & Greed Index: ~9). Total crypto market capitalization: ~$2.33 trillion. Bitcoin dominance: ~56.5%.
AI/ML Model Insight & Market Confluence
CoinResearch AI integrates Directional Prediction models (RF/XGBoost) and RNN Price Forecast models. Below are the RNN forecast outputs cross-validated with structure, momentum, and sentiment context.
Disclaimer:
The insights and forecasts presented here are generated by CoinResearch AI’s predictive models and supporting analytics. They are provided for informational and educational purposes only and do not constitute financial advice or investment recommendations. Trading digital assets involves risk, and users should conduct their own research, exercise independent judgment, and use appropriate risk management before making any investment or trading decisions.
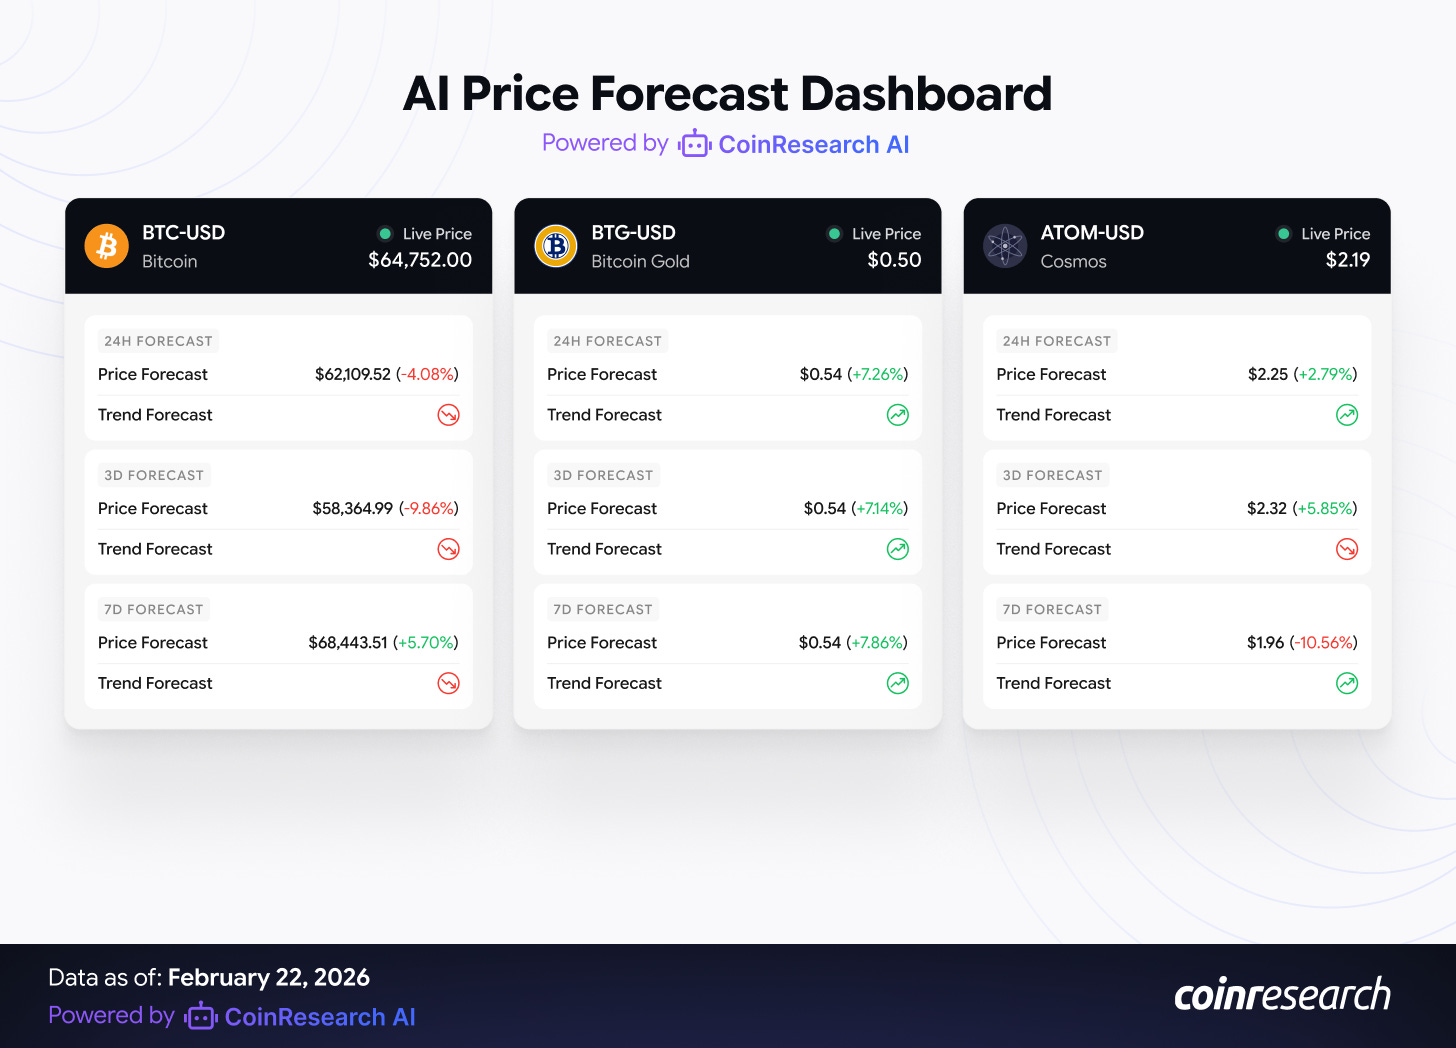
Bitcoin (BTC-USD) | Reference Price: $64,752.00
Price Prediction Model (RNN):
-
24H Forecast: $62,109.52 (-4.08%) | Previous 24H Forecast: $61,912.46 | Accuracy: 91.61%
-
3D Forecast: $58,364.99 (-9.86%) | Previous 3D Forecast: $62,924.05 | Accuracy: 93.10%
-
1W Forecast: $68,443.51 (+5.70%) | Previous 1W Forecast: $72,247.00 | Accuracy: 93.10%
Directional Model (Trend):
-
24H: ❌ Bearish | Win Rate: 57.14%
-
3D: ❌ Bearish | Win Rate: 57.14%
-
1W: ❌ Bearish | Win Rate: 78.57%
Analysis: Rare Full Bearish Alignment, A Capitulation Signal
This week’s BTC model outputs present the most unambiguously bearish setup across this edition’s three assets,and arguably the most significant signal CoinResearch AI has produced in recent months. Both the RNN price prediction model and the directional model agree on a near-term bearish trajectory: the RNN forecasts -4.08% at 24H and a severe -9.86% at 3D (targeting $58,365), while the directional model confirms bearish across all three timeframes. The 1W bearish directional signal at 78.57% win rate is the highest-conviction reading in this edition’s entire model suite.
The divergence appears at the 1W RNN forecast, which projects +5.70% upside to $68,443,a recovery target that directly contradicts the directional model’s 1W bearish call. This split is interpretively significant: the RNN model may be detecting mean-reversion potential at deeply oversold levels, while the directional model’s momentum-based signals remain firmly negative. Given the 78.57% win rate on the directional 1W bearish signal versus the RNN’s (still-strong) 93.10% accuracy, this creates genuine analytical tension.
Context:
Bitcoin is trading at $64,752 after Sunday’s flash crash,below the $65,000 structural floor that had held through weeks of testing. The exchange whale ratio at 0.64 (highest since 2015) and average deposit size of 1.58 BTC (highest since June 2022) confirm that large holders are actively distributing. A potential death cross between the 50 and 200 SMAs on the three-day chart is projected for late February, which historically has preceded further 30% declines. On the bullish side, Strategy’s continued accumulation (717,131 BTC total) and sovereign wealth fund buying (Abu Dhabi’s Mubadala) suggest that the smartest long-horizon capital is using this reset as an entry point.
The analyst team agrees with the near-term bearish consensus but remains cautious about the 3D target of $58,365, which implies a further ~10% decline from already oversold conditions. A retest of the $60,000–$62,000 zone is plausible; a clean break to $58K would require a macro catalyst (e.g., tariff escalation to China, unexpected CPI reversal). The 1W RNN recovery target of $68,443 is credible only if the $60,000–$62,000 zone holds as support and ETF flows stabilize.
Trade Action: HOLD / NO NEW LONGS (Wait for Confirmation)
-
Entry: No new longs at current levels. Wait for either (a) a confirmed daily close above $66,000 with positive ETF inflows, or (b) a capitulation wick to $60,000–$62,000 with a same-day recovery above $63,000.
-
Take Profit (TP): $67,500–$68,500 (aligned with 1W RNN target, if entry conditions met)
-
Stop Loss (SL): $58,000 (below 3D RNN target,if this breaks, the macro thesis shifts materially)
-
Risk/Reward: Variable depending on entry; current levels offer unfavorable R:R
-
Conviction Level: HIGH BEARISH near-term (Model alignment + technical breakdown + whale distribution). Medium-term outlook is uncertain until $60,000 support is tested.
Invalidation Conditions:
-
Consecutive days of net positive Bitcoin ETF inflows (>$200M cumulative over 3 days)
-
Bitcoin reclaims $66,500 on a daily close with above-average volume
-
Unexpected dovish Fed pivot or tariff de-escalation announcement
-
Death cross fails to materialize or is immediately bought
Bitcoin Gold (BTG-USD) | Reference Price: $0.50
Price Prediction Model (RNN):
-
24H Forecast: $0.54 (+7.26%) | Previous 24H Forecast: $0.54 | Accuracy: 99.51%
-
3D Forecast: $0.54 (+7.14%) | Previous 3D Forecast: $0.52 | Accuracy: 97.97%
-
1W Forecast: $0.54 (+7.86%) | Previous 1W Forecast: $0.50 | Accuracy: 94.53%
Directional Model (Trend):
-
24H: ✅ Bullish | Win Rate: 50.0%
-
3D: ✅ Bullish | Win Rate: 42.86%
-
1W: ✅ Bullish | Win Rate: 71.43%
Analysis: Full Bullish Alignment, But We Disagree (for now)
On paper, BTG presents the most bullish model setup this week: full bullish alignment across both the RNN price model and directional model across all three timeframes. The RNN accuracy scores are exceptionally high,99.51% at 24H and 97.97% at 3D,among the highest readings ever produced by the model suite. The directional model confirms with bullish signals across the board, with the 1W bullish reading at a solid 71.43% win rate.
However, we disagree with the models’ bullish thesis and recommend avoiding this trade entirely.
Context:
Bitcoin Gold is a deeply distressed micro-cap asset that has collapsed approximately 93.8% year-to-date and 98.3% from its all-time high. The token’s market capitalization sits at approximately $10 million with 24-hour trading volume as low as $34 in recent sessions. BTG’s 50-day SMA ($0.5666) and 200-day SMA ($0.7513) both sit far above the current price, confirming a catastrophic long-term downtrend. External algorithmic models project BTG’s year-end 2026 target at $0.42, implying further decline from here.
The critical issue is liquidity. With trading volume measured in dozens of tokens per day and a market cap of $10 million, BTG is functionally untradeable for any position of meaningful size. The RNN model’s high accuracy scores likely reflect the token’s low volatility around its depressed level rather than genuine predictive power,when a coin barely moves, predicting that it won’t move much registers as high accuracy. The bullish directional signals at 50.0% and 42.86% win rates are effectively coin-flip readings with no statistical significance.
Trade Action: NO TRADE (Avoid)
-
Entry: None. We strongly advise against trading BTG.
-
Rationale: The risk of permanent capital destruction in a micro-cap token with no liquidity, no narrative, and no institutional support outweighs any model-derived upside target of $0.54 (+7%). Even if the models are correct, the 7% upside on a $0.50 token amounts to $0.04 per token,a move that could easily be erased by a single whale exit in an illiquid order book.
-
Conviction Level: HIGH (Avoid),No trade is also a trade. Model accuracy here reflects stagnation, not opportunity.
Invalidation Conditions:
-
24H trading volume exceeds $500K consistently (signals genuine liquidity return)
-
BTG-specific catalyst (major exchange relisting, protocol upgrade, narrative shift)
-
Broader privacy/POW mining narrative revival with institutional backing
Cosmos (ATOM-USD) | Reference Price: $2.19
Price Prediction Model (RNN):
-
24H Forecast: $2.25 (+2.79%) | Previous 24H Forecast: $2.20 | Accuracy: 97.87%
-
3D Forecast: $2.32 (+5.85%) | Previous 3D Forecast: $2.18 | Accuracy: 97.00%
-
1W Forecast: $1.96 (-10.56%) | Previous 1W Forecast: $1.70 | Accuracy: 75.42%
Directional Model (Trend):
-
24H: ✅ Bullish | Win Rate: 50.0%
-
3D: ✅ Bullish | Win Rate: 64.29%
-
1W: ✅ Bullish | Win Rate: 78.57%
Analysis: Near-Term Bullish Confluence with Critical 1W RNN Divergence
ATOM presents the most analytically nuanced setup this week. The RNN price model is bullish at 24H (+2.79%, 97.87% accuracy) and 3D (+5.85%, 97.00% accuracy) but turns markedly bearish at 1W (-10.56% to $1.96). Meanwhile, the directional model is bullish across all three timeframes, with the 1W reading at a strong 78.57% win rate,directly contradicting the RNN’s 1W bearish price target.
This divergence is significant. The near-term RNN readings (97%+ accuracy) have proven reliable in tracking ATOM’s consolidation patterns. Previous forecasts of $2.20 (24H) and $2.18 (3D) aligned well with actual price behavior, establishing credibility. The 3D bullish target of $2.32 is achievable and aligns with the SMA 20 resistance at $2.06 and the upper Bollinger Band at $2.37. However, the 1W RNN target of $1.96 at 75.42% accuracy (the lowest accuracy reading across all models this week) introduces meaningful uncertainty. The directional model’s 1W bullish signal at 78.57% win rate pushes back against the RNN’s bearish call.
Context:
ATOM is trading at $2.19, making it one of this week’s relative outperformers with a +5.2% weekly gain. Cosmos sits significantly below its major moving averages (SMA 50 at $2.22), but the RSI reading of 36.90 places it in neutral territory with room for upside without extreme positioning constraints. The broader interoperability narrative remains intact as Espresso Network’s recent mainnet launch and the ongoing multi-chain expansion provide structural demand for Cosmos SDK-based infrastructure. External analyst targets project a short-term range of $2.10–$2.25 with a medium-term target of $2.45–$2.80 if key resistance at $1.97 (now surpassed) continues to hold as support.
The analyst team cautiously agrees with the near-term bullish thesis. The 97%+ RNN accuracy at 24H and 3D, combined with ATOM’s relative outperformance and interoperability narrative tailwinds, supports a tactical position. However, the 1W divergence between models demands exit discipline,if the 3D target of $2.32 is reached, take profits rather than hold through a potential reversal.
Trade Action: CAUTIOUS BUY (Small Position, 3-Day Max Hold)
-
Entry: Current levels (~$2.19)
-
Take Profit (TP): $2.30–$2.35 (aligned with RNN 3D target and upper Bollinger Band)
-
Stop Loss (SL): $2.05 (below SMA 20 and recent support zone)
-
Risk/Reward: ~1.1:1 at TP1 (modest, but favorable for a tactical trade)
-
Conviction Level: LOW-MODERATE (Strong near-term model confluence, but the 1W divergence, Extreme Fear macro environment, and Bitcoin’s structural breakdown limit conviction. This is a 1–2% of portfolio position maximum.)
Critical: Close position by Day 3. The 1W RNN bearish target of $1.96 (-10.56%) represents significant downside risk if held beyond the tactical window.
Invalidation Conditions:
-
Failure to break above $2.30 within 48 hours (momentum stall, exit at breakeven)
-
Bitcoin drops below $62,000 (risk-off cascade overrides altcoin outperformance)
-
Break below $2.05 on daily close (invalidates near-term support thesis)
-
Tariff escalation to China or unexpected hawkish Fed statement
Summary of Model Insights
This week’s model outputs represent a dramatic escalation from last edition’s cautiously constructive signals:
-
Bitcoin (BTC): Near-complete bearish alignment across both model systems,the first such signal in several editions. The 78.57% win rate 1W directional bearish reading is the highest-conviction signal this week. The RNN’s 1W recovery target of $68,443 provides a potential relief rally target, but only after the near-term bearish thesis plays out. No new longs recommended.
-
Bitcoin Gold (BTG): Full bullish model alignment, but we reject the signal. BTG’s catastrophic liquidity profile, micro-cap status, and year-to-date 93.8% decline make the model outputs unreliable for actionable trading. The high RNN accuracy reflects stagnation, not opportunity. No trade recommended.
-
Cosmos (ATOM): Near-term bullish confluence (97%+ RNN accuracy at 24H/3D) with a meaningful 1W divergence between models. The setup favors a disciplined tactical trade with strict exits. Small cautious buy for 3-day maximum hold.
Key Takeaway: This edition marks a clear shift back toward defensive positioning. Unlike last week,where selective opportunities were emerging at oversold levels,this week’s Sunday flash crash, FOMC hawkish surprise, and tariff escalation have reset the risk landscape. The BTC model’s bearish alignment, combined with the highest exchange whale ratio since 2015, signals that we are not yet at the capitulation bottom. The operational guidance shifts from “selective small-position trades” back to “capital preservation and patience.” For disciplined traders, the emerging opportunity window is the $60,000–$62,000 BTC zone,but only with confirmed support and volume.
Note: This dashboard presents a snapshot of 3 sample forecasts from CoinResearch AI’s predictive models. The full version includes over 100 continuously updated AI-driven forecasts, accessible to users directly on our platform starting from $9/mo.
Token Launch & Ecosystem Radar
A curated look at three high-signal projects approaching major milestones. Each combines strong backers, transparent development, and real execution momentum.
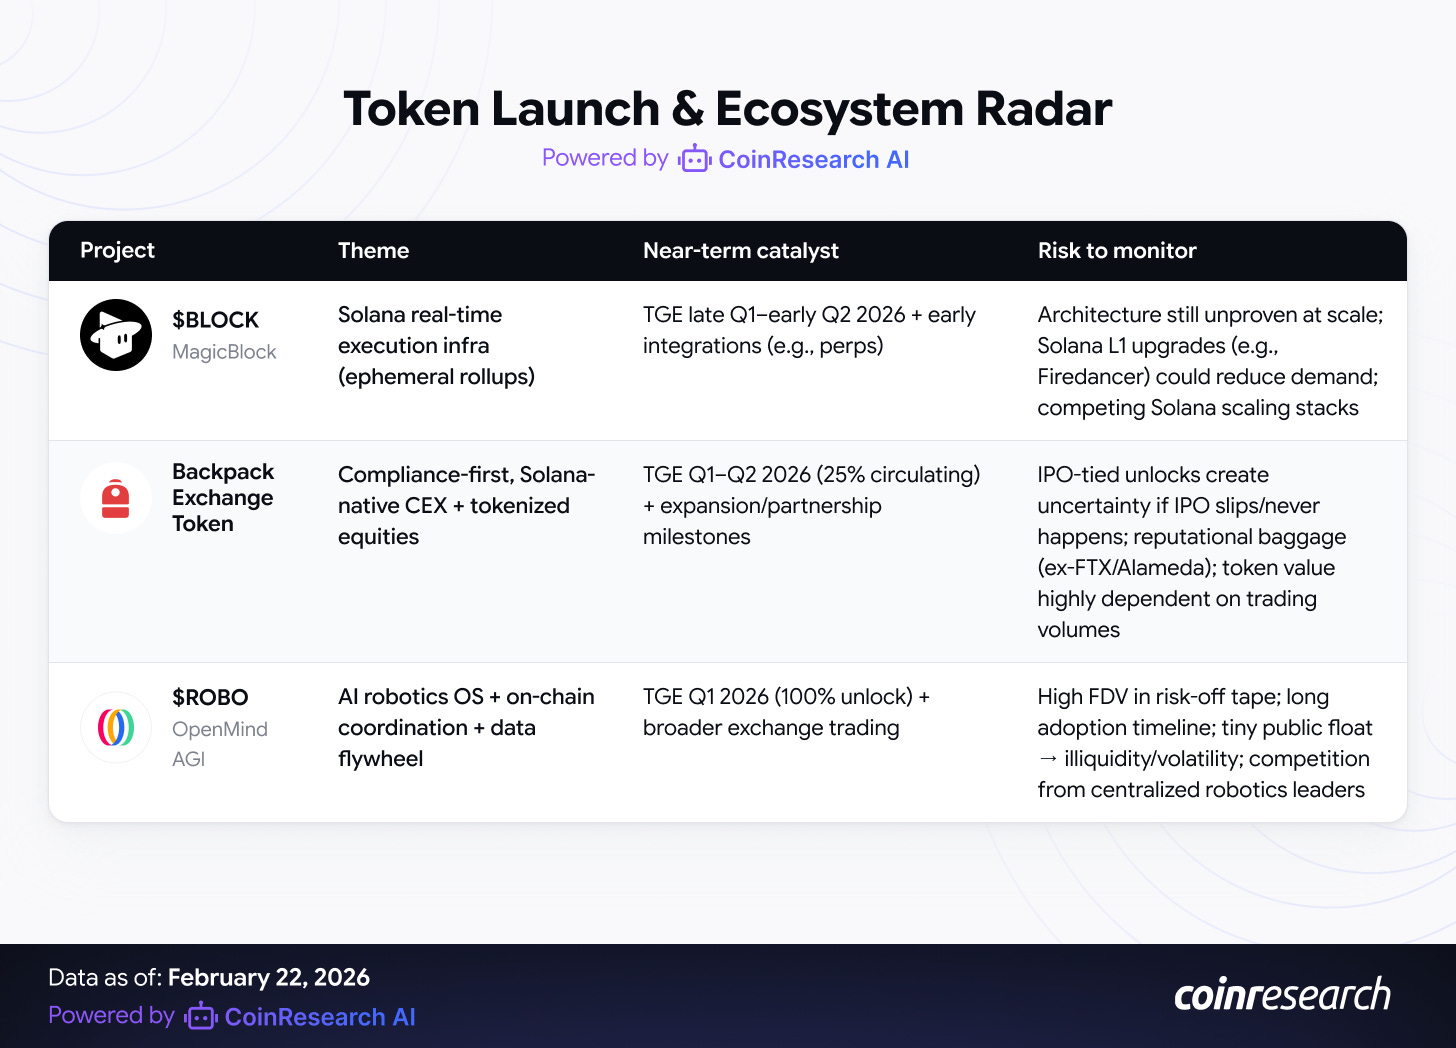
MagicBlock ($BLOCK) | Real-Time Engine for Solana Applications
-
Launch Date: Presale completed February 2026; TGE expected late Q1–Q2 2026, token not yet listed on major exchanges.
-
Thesis: MagicBlock builds “Ephemeral Rollups” on Solana to run high‑throughput apps like gaming and perp DEXs in isolated, short‑lived environments, offloading heavy compute while settling back to Solana.
-
Risk: Adoption depends on developers choosing a new execution layer over Solana’s own upgrades (e.g., Firedancer); if base‑layer scaling is enough, demand for a separate rollup stack could be limited.
Backpack Exchange Token | Compliance-First Solana-Native CEX
-
Launch Date: Token launch planned for Q1–Q2 2026 with 25% of the 1B supply circulating at TGE; remaining supply vests around post‑IPO milestones.
-
Thesis: Backpack is a Solana‑native, compliance‑focused exchange whose token aligns incentives by tying large unlocks to exchange growth and a future IPO instead of insider dumps.
-
Risk: Success hinges on Backpack achieving real trading volume and listing in a tough post‑FTX environment; if IPO plans stall, the long‑dated unlock structure may become an overhang.
OpenMind AGI ($ROBO) | Decentralized AI Robotics Operating System
-
Launch Date: Public sale closed January 2026 at ~$400M FDV; token in preview on trackers with TGE expected later in Q1 2026.
-
Thesis: OpenMind aims to coordinate fleets of AI robots via a blockchain‑based operating system, rewarding users for real‑world data that trains autonomous agents.
-
Risk: The AI‑robotics‑crypto thesis is highly speculative and long‑dated; the rich initial valuation and tiny public allocation could create volatile and illiquid trading once the token goes live.
Strategic Recap & Forward Outlook
The week ending February 22, 2026, removes any remaining ambiguity about the market’s trajectory: the consolidation-as-potential-accumulation thesis that held cautious appeal last week has been invalidated by Sunday night’s flash crash below $65,000. The market is now in a new, more dangerous phase,one where the structural floor has been breached and the next clear support lies at $60,000–$62,000.
Key Takeaways:
-
The FOMC minutes changed the rate calculus. The explicit mention of potential rate hikes,not just a “higher for longer” hold,is qualitatively different from what the market had been pricing. The January CPI’s dovish implications have been partially neutralized by the Fed’s own uncertainty about inflation’s trajectory. Rate cut expectations for 2026 now carry a wider confidence interval, and crypto, as the highest-beta risk asset, absorbs the damage disproportionately.
-
Whale distribution is the most dangerous signal. The exchange whale ratio at its highest since 2015 and average deposit sizes at June 2022 levels indicate that large holders are actively selling into whatever bids remain. This is not the behavior pattern observed at cycle bottoms,it is the pattern observed during the penultimate phase of capitulation, where smart money exits before the final retail flush. Until whale exchange inflows meaningfully decline, treat any bounce as a distribution event.
-
The tariff escalation creates asymmetric downside risk. Trump’s move from 10% to 15% global tariffs is not a one-time event,it establishes a precedent for further escalation. If tariffs extend specifically to China or key technology imports, the inflationary impact could reverse the CPI disinflation trajectory that was crypto’s best macro hope. The correlation between crypto and risk assets remains elevated at approximately 0.73 with the tech sector, meaning any equity market disruption from tariff-driven inflation fears will cascade directly into digital assets.
-
$60,000–$62,000 is the new line in the sand for Bitcoin. The $65,000 floor that held through two weeks of testing has now been decisively breached. On-chain models, technical analysts, and the RNN model’s 3D forecast ($58,365) all converge on the $58,000–$62,000 zone as the next meaningful support. A sustained break below $58,000 would open the door to the 200-week moving average near $52,000–$55,000,a level that, if reached, would represent a greater-than-50% drawdown from October 2025 highs near $126,000.
Forward Outlook (Week Ending March 1, 2026):
The base case for the coming week is a continuation of bearish pressure with a potential capitulation wick toward $60,000–$62,000 for Bitcoin, followed by an attempted relief bounce. The BTC range is expected at $59,000–$67,000,wider and more volatile than recent weeks as the market searches for a new equilibrium below the broken $65,000 floor. Ethereum is expected to trade between $1,750 and $2,050, with $1,850 as the key support level to watch. Altcoins will likely underperform on a beta-adjusted basis, as the Extreme Fear environment and Bitcoin’s structural breakdown compress risk appetite further.
Key catalysts for the week ahead:
-
PCE Price Index (Friday, February 27): The Fed’s preferred inflation gauge. A hotter-than-expected reading would cement the hawkish FOMC narrative and likely trigger another leg down; a cooler reading could provide temporary relief
-
Bitcoin/Ethereum Monthly Options Expiry (February 28, Deribit): Max pain dynamics may influence price in the days leading up to expiry; heavy put positioning suggests continued downside hedging
-
SEC XRP ETF Decision (~February 26): Approval would be a powerful narrative catalyst for XRP and potentially the broader market; rejection or delay could add to selling pressure
-
Bitcoin ETF flow data (daily): The single most important real-time indicator. Three consecutive days of net inflows (>$100M cumulative) would be the earliest possible bullish structural signal; continued outflows extend the bear thesis
-
Fed speakers (Waller, Goolsbee, Bostic, Collins): Watch for any softening of the rate hike language from the FOMC minutes; divergent views among speakers could provide short-term volatility
-
CME Group 24/7 crypto trading (May 29 launch announced): Not an immediate catalyst, but a structural positive for institutional participation and price discovery
Disclaimer: This analysis is for informational purposes only and should not be construed as investment advice. Cryptocurrency markets carry substantial risk, including the potential loss of principal. Past performance does not guarantee future results. Always conduct your own due diligence and consult a qualified financial advisor before making investment decisions.