
ETH Leads, Macro Decides | Week Ending July 26, 2026

1. ETH Leads, Macro Decides
Bitcoin closed Sunday at $65,330, up +1.0% week-on-week, while Ethereum closed at $1,953, up +4.4%. The difference matters. ETH did not merely follow BTC higher: it led both price performance and US spot-ETF demand, with approximately $103.8 million of net ETF inflows from July 20-24 versus $33.9 million for BTC. ETH dominance improved to 10.1%, while BTC dominance held near 56.5%. That is evidence of a real relative rotation, but not yet a broad altcoin expansion.
The rest of the market remained selective. SOL was nearly flat, BNB and the major payment tokens posted only modest gains, and HYPE and RAIN closed lower. Fear & Greed ended Sunday at 26 – Fear after falling to 25 – Extreme Fear on July 21. Both BTC and ETH ETF flows also reversed into outflows on Friday. The market therefore enters the July 28-29 FOMC meeting with better ETH participation, but without the breadth or sentiment confirmation that would justify a blanket risk-on call. This week is about whether macro conditions validate the rotation or expose it as a narrow pre-event trade.
Key themes this week:
-
ETH led both price performance and weekly spot-ETF demand.
-
BTC held its range, but 56.5% dominance still argues against calling a broad altseason.
-
Friday ETF outflows and a Fear reading show that institutional and retail conviction remain incomplete.
-
The FOMC, GDP, PCE, and Employment Cost Index create a concentrated macro test for the recovery.
2. Strengths: What Is Holding
-
ETH produced the clearest relative-strength signal. Ethereum gained 4.4% from Sunday close to Sunday close, reached a weekly high of $1,953, and attracted roughly three times BTC’s net US spot-ETF inflow in dollar terms. That combination gives the move a stronger foundation than price alone. The caveat: Friday’s $70.7 million ETH ETF outflow interrupted the sequence, so the institutional bid did not finish the week with momentum.
-
BTC defended its lower range and still closed higher. Bitcoin traded down to $63,800, recovered, and finished at $65,330 rather than near the weekly low. The market absorbed another test without returning to the late-June liquidation regime. The caveat: BTC also failed to hold the $66,826 weekly high, leaving the asset inside a range rather than in a confirmed breakout.
-
The rotation has an observable institutional component. US spot ETH ETFs took in a net $103.8 million over the five sessions from July 20-24, compared with $33.9 million for BTC. Farside’s BTC and ETH flow tables show that the relative-demand gap was substantial. The caveat: both products ended Friday in outflow, so the useful claim is relative ETH strength, not an uninterrupted allocation wave.
3. Weaknesses: What Has Not Been Repaired
-
Breadth did not confirm ETH’s move. SOL gained only 0.4%, BNB 0.7%, XRP 1.5%, TRX 1.5%, and DOGE 1.5% on the same Sunday-close basis. Those are positive closes, but they are not the synchronized high-beta participation normally associated with a durable altcoin expansion.
-
Speculative leaders still showed fragility. HYPE fell 2.3% and RAIN fell 2.2% even as BTC and ETH advanced. When liquidity is becoming broadly risk-seeking, the speculative cohort usually confirms rather than diverges.
-
The macro calendar compresses several repricing risks into three sessions. The Federal Reserve meets July 28-29. The US Q2 GDP advance estimate and June Personal Income and Outlays, including PCE inflation, follow on July 30, and the Q2 Employment Cost Index arrives July 31. The dates are confirmed by the Federal Reserve, BEA, and BLS.
4. Market Recap: Weekly Performance
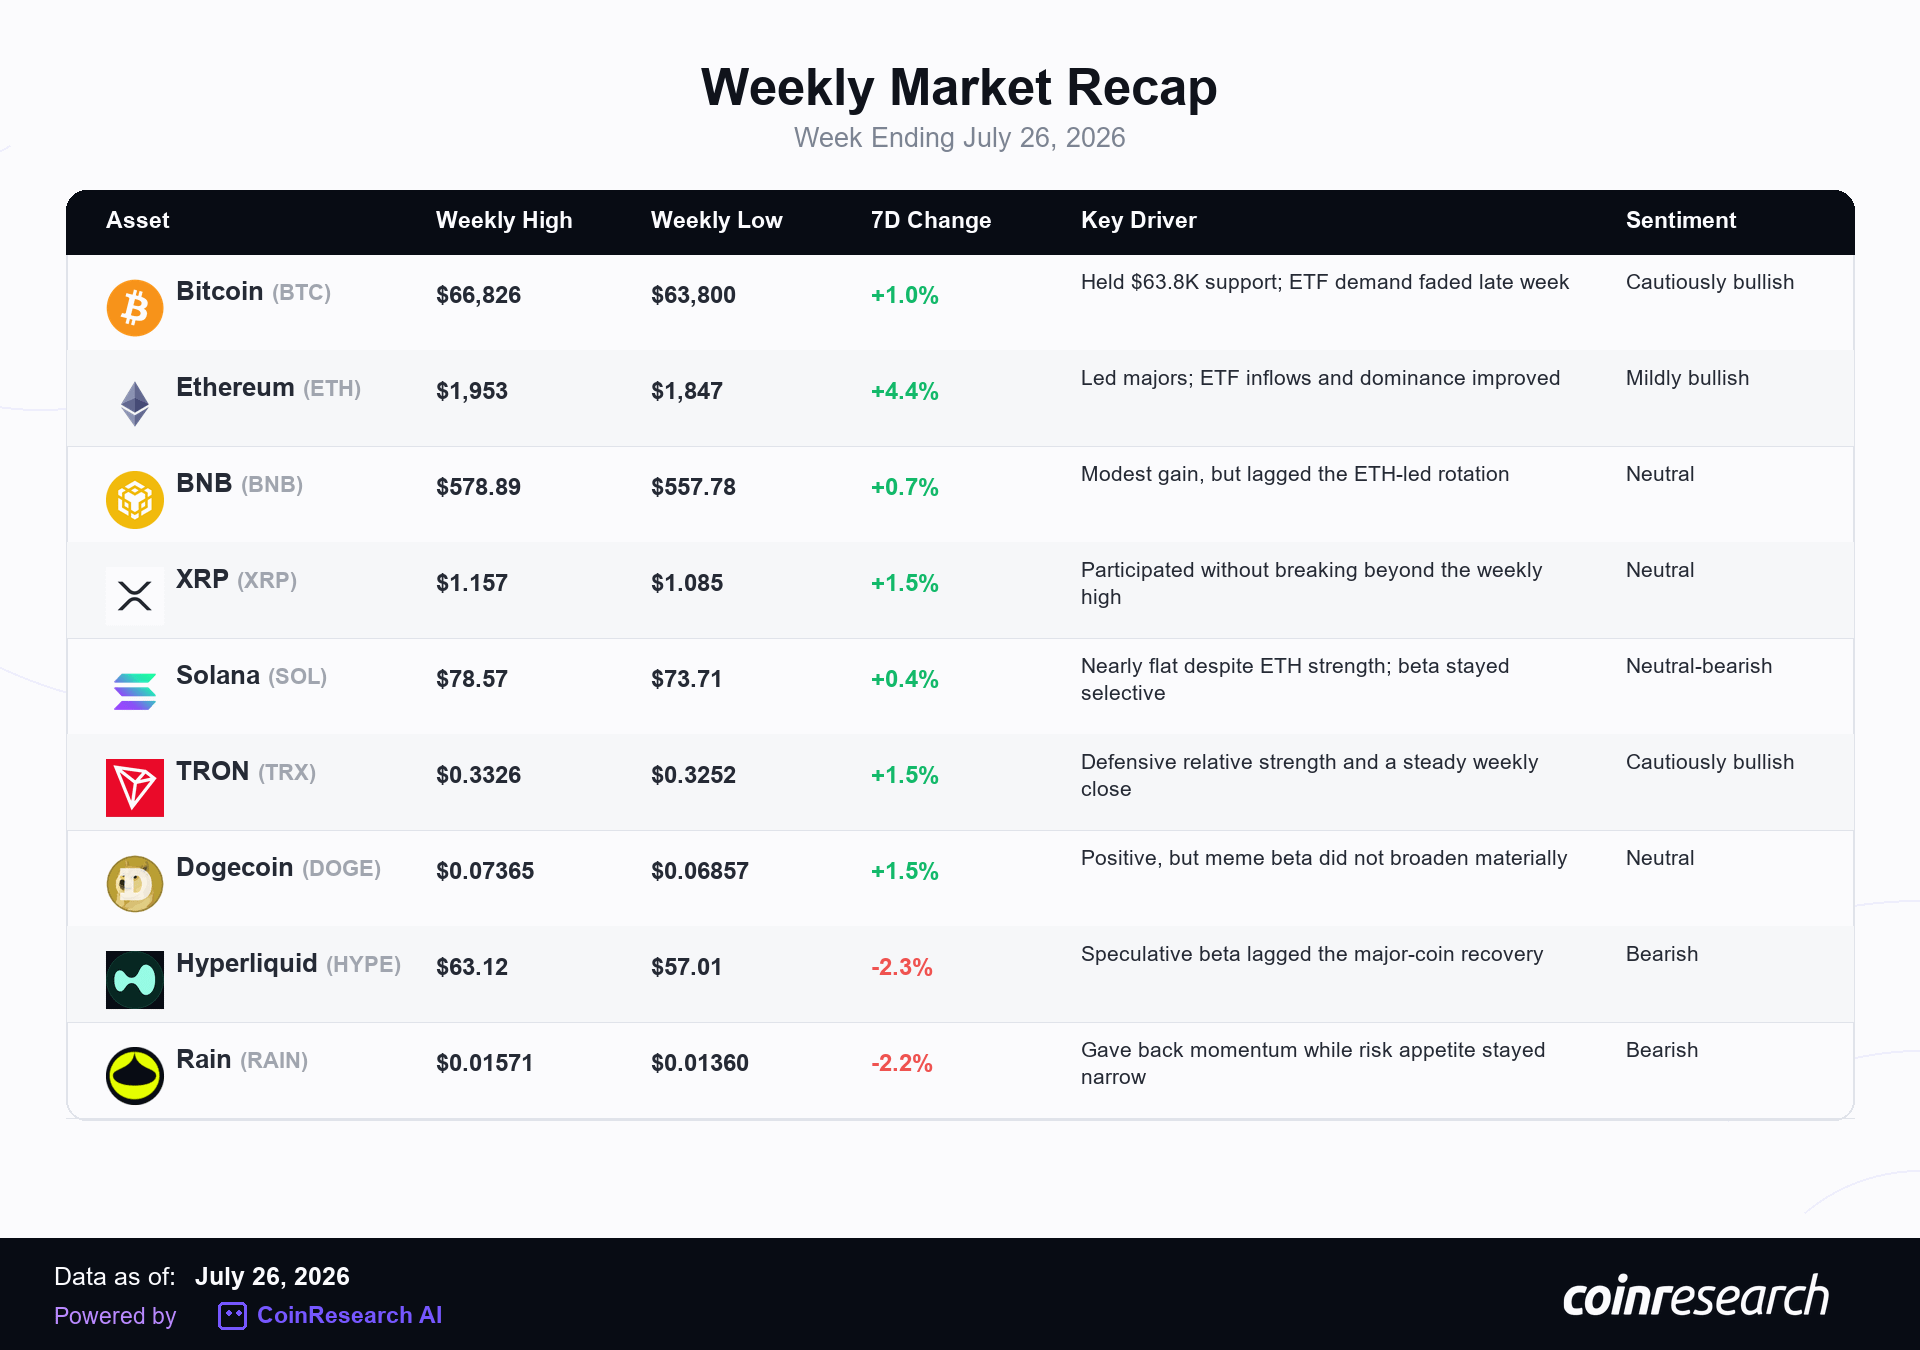
The major-coin board finished mostly positive, but the distribution was uneven. BTC closed at $65,330 (+1.0% W/W) and ETH at $1,953 (+4.4%). BNB added 0.7%, XRP 1.5%, SOL 0.4%, TRX 1.5%, and DOGE 1.5%. HYPE and RAIN moved the other way, falling 2.3% and 2.2% respectively. ETH was the week’s leader; the rest of the market supplied only partial confirmation.
5. Predictive Analytics & Trade Confluence
Disclaimer: The insights and forecasts presented here are generated by CoinResearch AI’s predictive models and supporting analytics. They are provided for informational and educational purposes only and do not constitute financial advice or investment recommendations. Trading digital assets involves risk, and users should conduct their own research, exercise independent judgment, and use appropriate risk management before making any investment or trading decisions.
DOT-USD (Polkadot)
Reference Price: $0.816
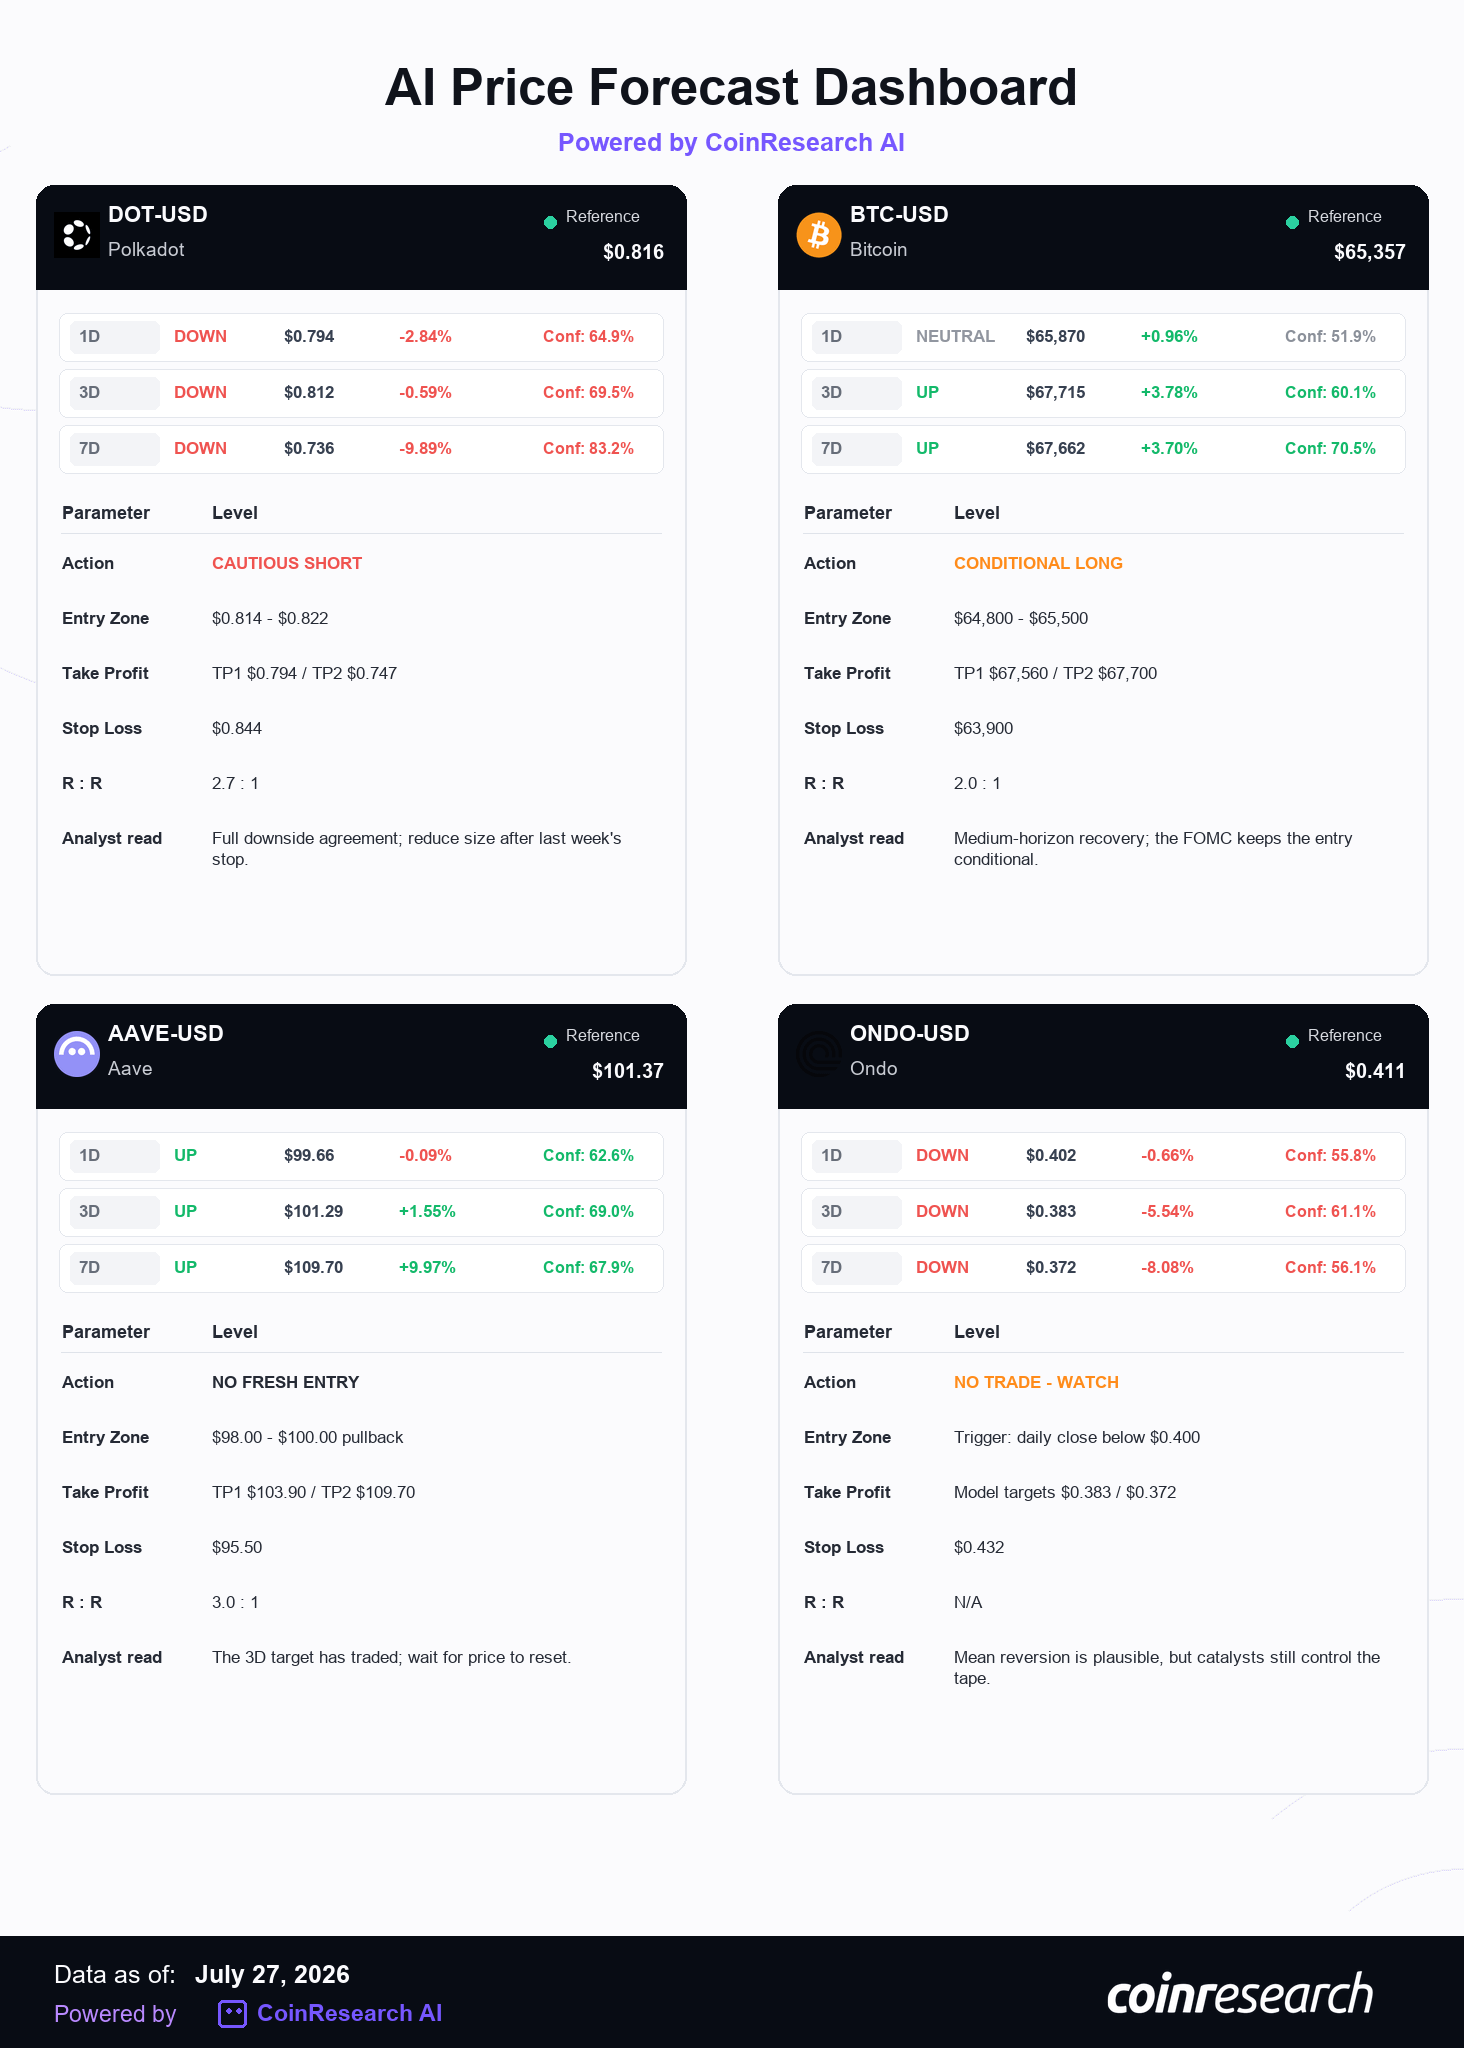
Market Confluence Analysis. The model says DOWN across 1D, 3D, and 7D, with both model versions agreeing at every horizon. Confidence rises from 64.9% in one day to 83.2% over seven days, while the seven-day regression target falls to $0.736. The likely observable cause is persistent relative weakness. DOT gained only 1.2% over seven days and remained down 3.4% over 30 days at the live CoinGecko pull, even as BTC rose and ETH-led beta strengthened. The model is treating that failed participation as a trend-persistence signal rather than a temporary lag.
Polkadot’s economic reforms create a countercase. The network now describes a 2.1 billion DOT hard cap and declining issuance, while the Dynamic Allocation Pool changes how issuance and system revenue are allocated. Polkadot’s platform economics and the DAP roadmap improve the long-run framework, but have not produced relative price strength. We remain bearish with smaller size after last week’s stopped short.
Trade Action.
-
Action: Cautious Short on a failed retest.
-
Entry Zone: $0.814-$0.822.
-
Take Profit: TP1 $0.794; TP2 $0.747.
-
Stop Loss: $0.844.
-
R:R: Approximately 2.7:1 to TP2 from the middle of the entry zone.
-
Rationale: Full cross-horizon and cross-version downside agreement, with DOT still underperforming the stronger parts of the market.
-
Invalidation: A sustained close above $0.844 would show that relative weakness is no longer controlling the trade.
-
Analyst Note. The model is likely reading the same failure to participate that is visible in the tape. That cause remains intact, but last week’s stop is a warning against oversizing a repeated thesis.
-
Verdict: CAUTIOUS SHORT, reduced size.
BTC-USD (Bitcoin)
Reference Price: $65,357
Market Confluence Analysis. BTC is neutral over one day but turns UP over three and seven days, with both model versions agreeing and confidence reaching 70.5% at seven days. The 3D and 7D point forecasts cluster tightly around $67,700. The likely cause is medium-horizon trend persistence after support held: BTC gained 2.4% over seven days and 8.4% over 30 days, while the model snapshot found price above the previous week’s lower range.
The market does not support an unconditional long. US spot BTC ETFs recorded only $33.9 million of net inflow over July 20-24 after $465.2 million of combined Thursday-Friday outflow. Farside’s flow table explains the neutral one-day call: recovery remains intact, but the institutional bid weakened into the weekend. The July 28-29 FOMC meeting adds event risk. The medium-horizon cause survives only while support holds.
Trade Action.
-
Action: Conditional Long.
-
Entry Zone: $64,800-$65,500, while the zone holds.
-
Take Profit: TP1 $67,560; TP2 $67,700.
-
Stop Loss: $63,900.
-
R:R: Approximately 2.0:1 to TP2 from the middle of the entry zone.
-
Rationale: 3D and 7D model agreement, a defended weekly range, and stronger medium-term momentum than the one-day signal.
-
Invalidation: A decisive loss of $63,900 would invalidate the support-hold mechanism behind the forecast.
-
Analyst Note. The model says the next several days look better than the next several hours. That is a conditional support trade, not permission to chase a pre-FOMC spike.
-
Verdict: CONDITIONAL LONG.
AAVE-USD (Aave)
Reference Price: $101.37
Market Confluence Analysis. AAVE is classified UP across all three horizons, with 3D and 7D model-version agreement and a seven-day target of $109.70. The likely cause is momentum plus sector confirmation: AAVE rose 13.3% over seven days and 8.5% in the latest 24 hours while ETH led. Governance around V4 also provides a concrete DeFi catalyst. Aave’s activation proposal describes its guarded hub-and-spoke rollout.
The model’s internal tension is equally important. Its one-day direction is UP, but the one-day regression return is -0.09% and the two model versions disagree. More importantly, the live price has already traded above the $101.29 three-day point forecast. We think the longer-horizon cause can remain durable because ETH and DeFi leadership are real, but part of the model’s expected move is already priced. Buying the current extension would confuse a correct directional thesis with a good entry.
Trade Action.
-
Action: No fresh entry; conditional pullback long only.
-
Entry Zone: $98.00-$100.00 after a successful retest.
-
Take Profit: TP1 $103.90; TP2 $109.70.
-
Stop Loss: $95.50.
-
R:R: Approximately 3.0:1 to TP2 from a $99 reference entry.
-
Rationale: Constructive 3D/7D model structure and a live V4/ETH catalyst, offset by an extended 24-hour move and a reached 3D forecast.
-
Invalidation: A loss of $95.50 would turn the expected pullback into a failed momentum structure.
-
Analyst Note. The model may be right about AAVE and still be too late for a fresh market order. Wait for price to offer the risk-reward again.
-
Verdict: NO FRESH ENTRY – pullback watch.
ONDO-USD (Ondo)
Reference Price: $0.411
Market Confluence Analysis. ONDO is DOWN across 1D, 3D, and 7D, with both model versions agreeing at every horizon and regression targets falling from $0.402 to $0.372. The likely observable cause is mean reversion after a rapid expansion: ONDO gained 20.6% over seven days, 28.5% over 30 days, and another 5.7% in the latest 24 hours. A model trained to detect short-term exhaustion would reasonably interpret that acceleration as downside risk.
Our reasoning rejects a fresh short. Seven-day accuracy is only 40%, confidence falls to 56.1%, and the move has fundamental support. Ondo announced a US tokenized-securities expansion on July 2; SBI followed with a July 16 partnership covering tokenized Japanese assets and distribution. Ondo’s announcement and SBI’s release make this more than an anonymous momentum spike. The market has not confirmed that the catalyst is exhausted.
Trade Action.
-
Action: No Trade – breakdown watch.
-
Trigger Level: A daily close below $0.400.
-
Model Targets: $0.383 over three days; $0.372 over seven days.
-
Risk Level: $0.432, the one-day ATR ceiling.
-
R:R: Not assigned until the breakdown creates a defined entry.
-
Rationale: Full bearish model agreement is offset by weak seven-day accuracy, strong live momentum, and fresh adoption catalysts.
-
Invalidation: Continued acceptance above $0.412, or a clean break above $0.432, would show that catalyst-driven demand remains stronger than the mean-reversion signal.
-
Analyst Note. This is exactly where analyst judgment should overrule a mechanically clean model card. The model explains a credible exhaustion risk; the tape has not yet agreed.
-
Verdict: NO TRADE – require breakdown confirmation.
6. Token Launch & Ecosystem Radar
This week’s radar favors projects with an operating product, a traceable token path, and a concrete question that can be monitored before launch. All three remained pre-TGE in the current official-source checks and are absent from the prior-edition tracker.
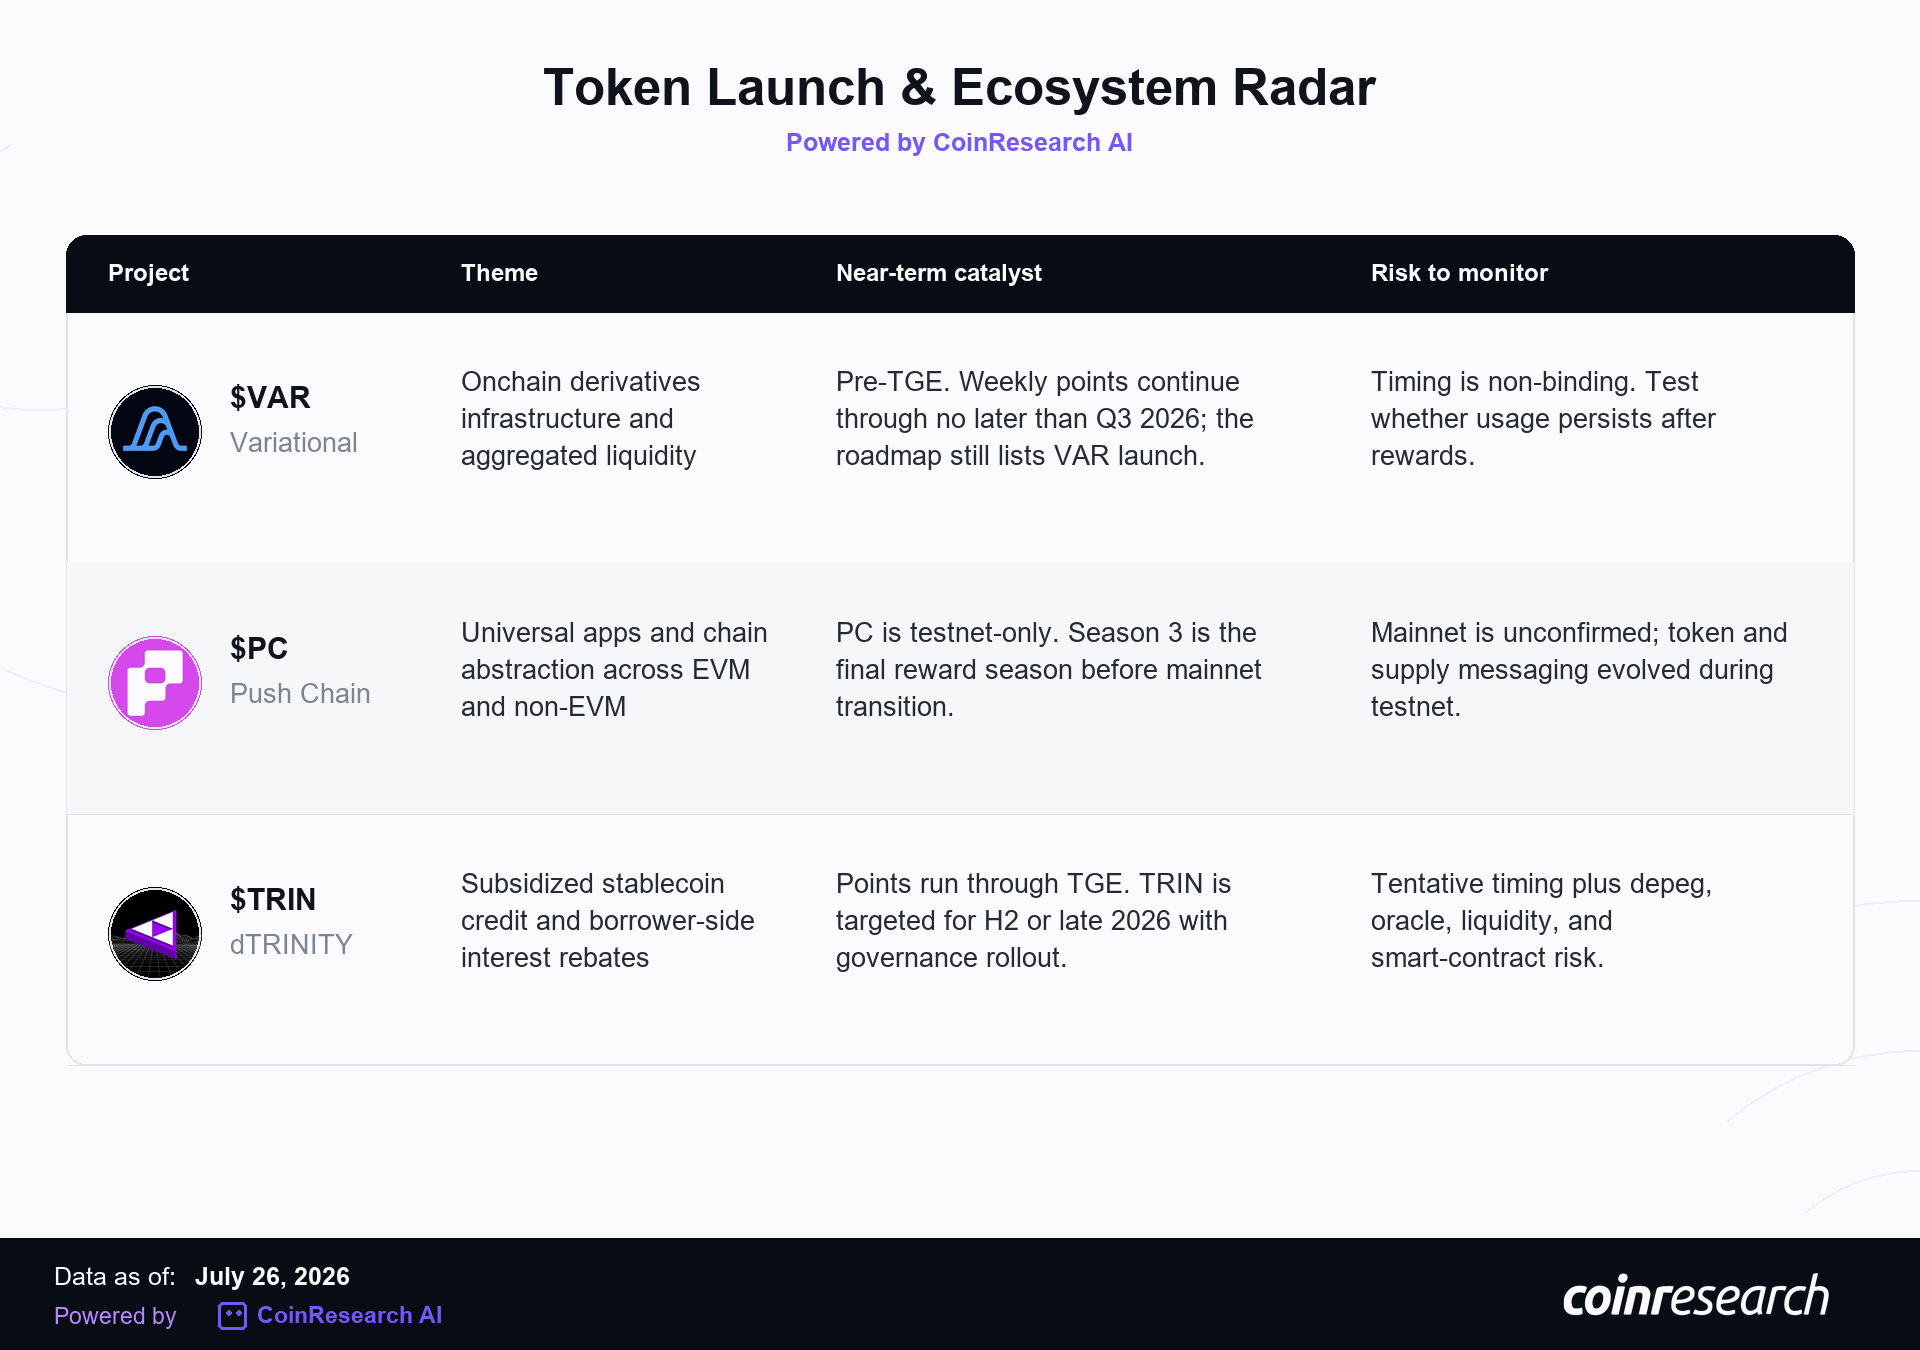
Variational ($VAR) – onchain derivatives infrastructure that aggregates liquidity for perpetual and generalized derivatives markets.
-
Why watch it: Variational connects token expectations to an operating derivatives venue rather than a standalone points campaign. The eventual investment case depends on whether trading activity can support the protocol’s proposed revenue and token-economics loop.
-
Current Status: Pre-TGE. Official documentation says `$VAR` is not live. Weekly points continue through no later than the end of Q3 2026, and the current roadmap still lists the token launch without making the timing binding.
-
Monitoring Rationale: Watch whether usage persists as incentives mature, how points map to circulating supply, and whether the launch terms preserve a credible link between protocol activity and token demand.
Push Chain ($PC) – a universal execution layer designed to let applications serve EVM and non-EVM users without making the user manage the underlying chain.
-
Why watch it: Push Chain is an observable test of the chain-abstraction thesis. The useful question is not whether a testnet can attract campaigns, but whether universal applications create recurring mainnet transactions after incentives decline.
-
Current Status: Pre-mainnet TGE. Official tokenomics state that `$PC` is live only on testnet, while Season 3 is described as the final rewards season before the mainnet transition. The official setup documentation still says mainnet is coming soon rather than giving a fixed launch date.
-
Monitoring Rationale: Track the confirmed mainnet date, reward conversion, circulating supply, and whether application activity extends beyond the reward cohort. Token naming and supply messaging have evolved during testnet, so final launch terms matter.
dTRINITY ($TRIN) – a stablecoin-credit protocol that uses reserve income to subsidize borrower interest and encourage lending-market utilization.
-
Why watch it: The design creates a measurable economic claim: reserve yield should lower effective borrowing costs, increase credit demand, and improve lender utilization. That mechanism can be evaluated before assigning value to governance.
-
Current Status: Pre-TGE. Official documentation targets the second half of 2026, with the FAQ pointing to late 2026. The dT Points program runs through TGE and is intended to convert into `$TRIN`, while tokenomics and veTRIN remain roadmap items.
-
Monitoring Rationale: Measure whether subsidized borrowing produces durable money velocity without weakening dUSD risk controls. Launch timing remains tentative, and the design carries depeg, oracle, liquidity, and smart-contract risk.
7. Strategic Recap & Forward Outlook
The market answered last week’s breadth question only partially. ETH developed a stronger relative bid and BTC preserved its range, but the speculative cohort did not join them consistently. The prior model slate also supplied useful accountability: the Edition #36 DOT short entered and then hit its $0.846 stop before reaching TP1, while the BTC conditional long traded through its entry zone but expired without touching either target or stop. The lesson is not that direction is unknowable. It is that strong model structure still requires entry discipline and a market that follows through.
Forward Outlook – Week of July 27 – August 2, 2026
-
Macro Watch. The July 28-29 FOMC meeting is the first decision point. It is followed on July 30 by the Q2 GDP advance estimate and June Personal Income and Outlays, including PCE inflation, then the Q2 Employment Cost Index on July 31. The relevant mechanism is rates sensitivity: a benign inflation-and-growth mix can validate the ETH-led rotation, while a higher-for-longer repricing would test whether Friday’s ETF outflows were the start of a broader retreat.
-
BTC Key Levels. The immediate range is defined by the $63,800 weekly low and $66,826 weekly high. A sustained break above the high would strengthen the recovery case; a loss of the low would return attention to the prior week’s lower support. Inside that band, BTC is stabilizing rather than trending.
-
Altcoin Outlook. ETH has earned relative-strength status, but the market has not earned an altseason label. The next confirmation would be broader participation from SOL and liquid large-cap beta while ETH retains its ETF advantage. If ETH remains strong but speculative leaders continue to lag, the more accurate framework is selective rotation rather than portfolio-wide risk-on.
For full prediction dashboards, trade setups, and live model signals, visit
CoinResearch Intelligence Weekly is published for educational and informational purposes only. Nothing in this newsletter constitutes financial advice. Cryptocurrency markets are highly volatile – past performance does not guarantee future results. Always conduct your own research and consult a qualified financial adviser before making investment decisions.