
The Fed Held, Risk Didn’t | Week Ending August 2, 2026

1. The Fed Held, Risk Didn’t
Bitcoin closed Sunday at $63,470, down 2.8% week-on-week, while Ethereum closed at $1,882, down 3.6%. The Federal Reserve left its target range unchanged at 3.50%-3.75%, but the decision did not remove policy risk. Three voters preferred a 25-basis-point increase, second-quarter real GDP slowed to a 1.5% annualized pace, and the gross domestic purchases price index rose 5.7%. For crypto, that is an uncomfortable combination: weaker growth without a clean release from inflation or discount-rate pressure.
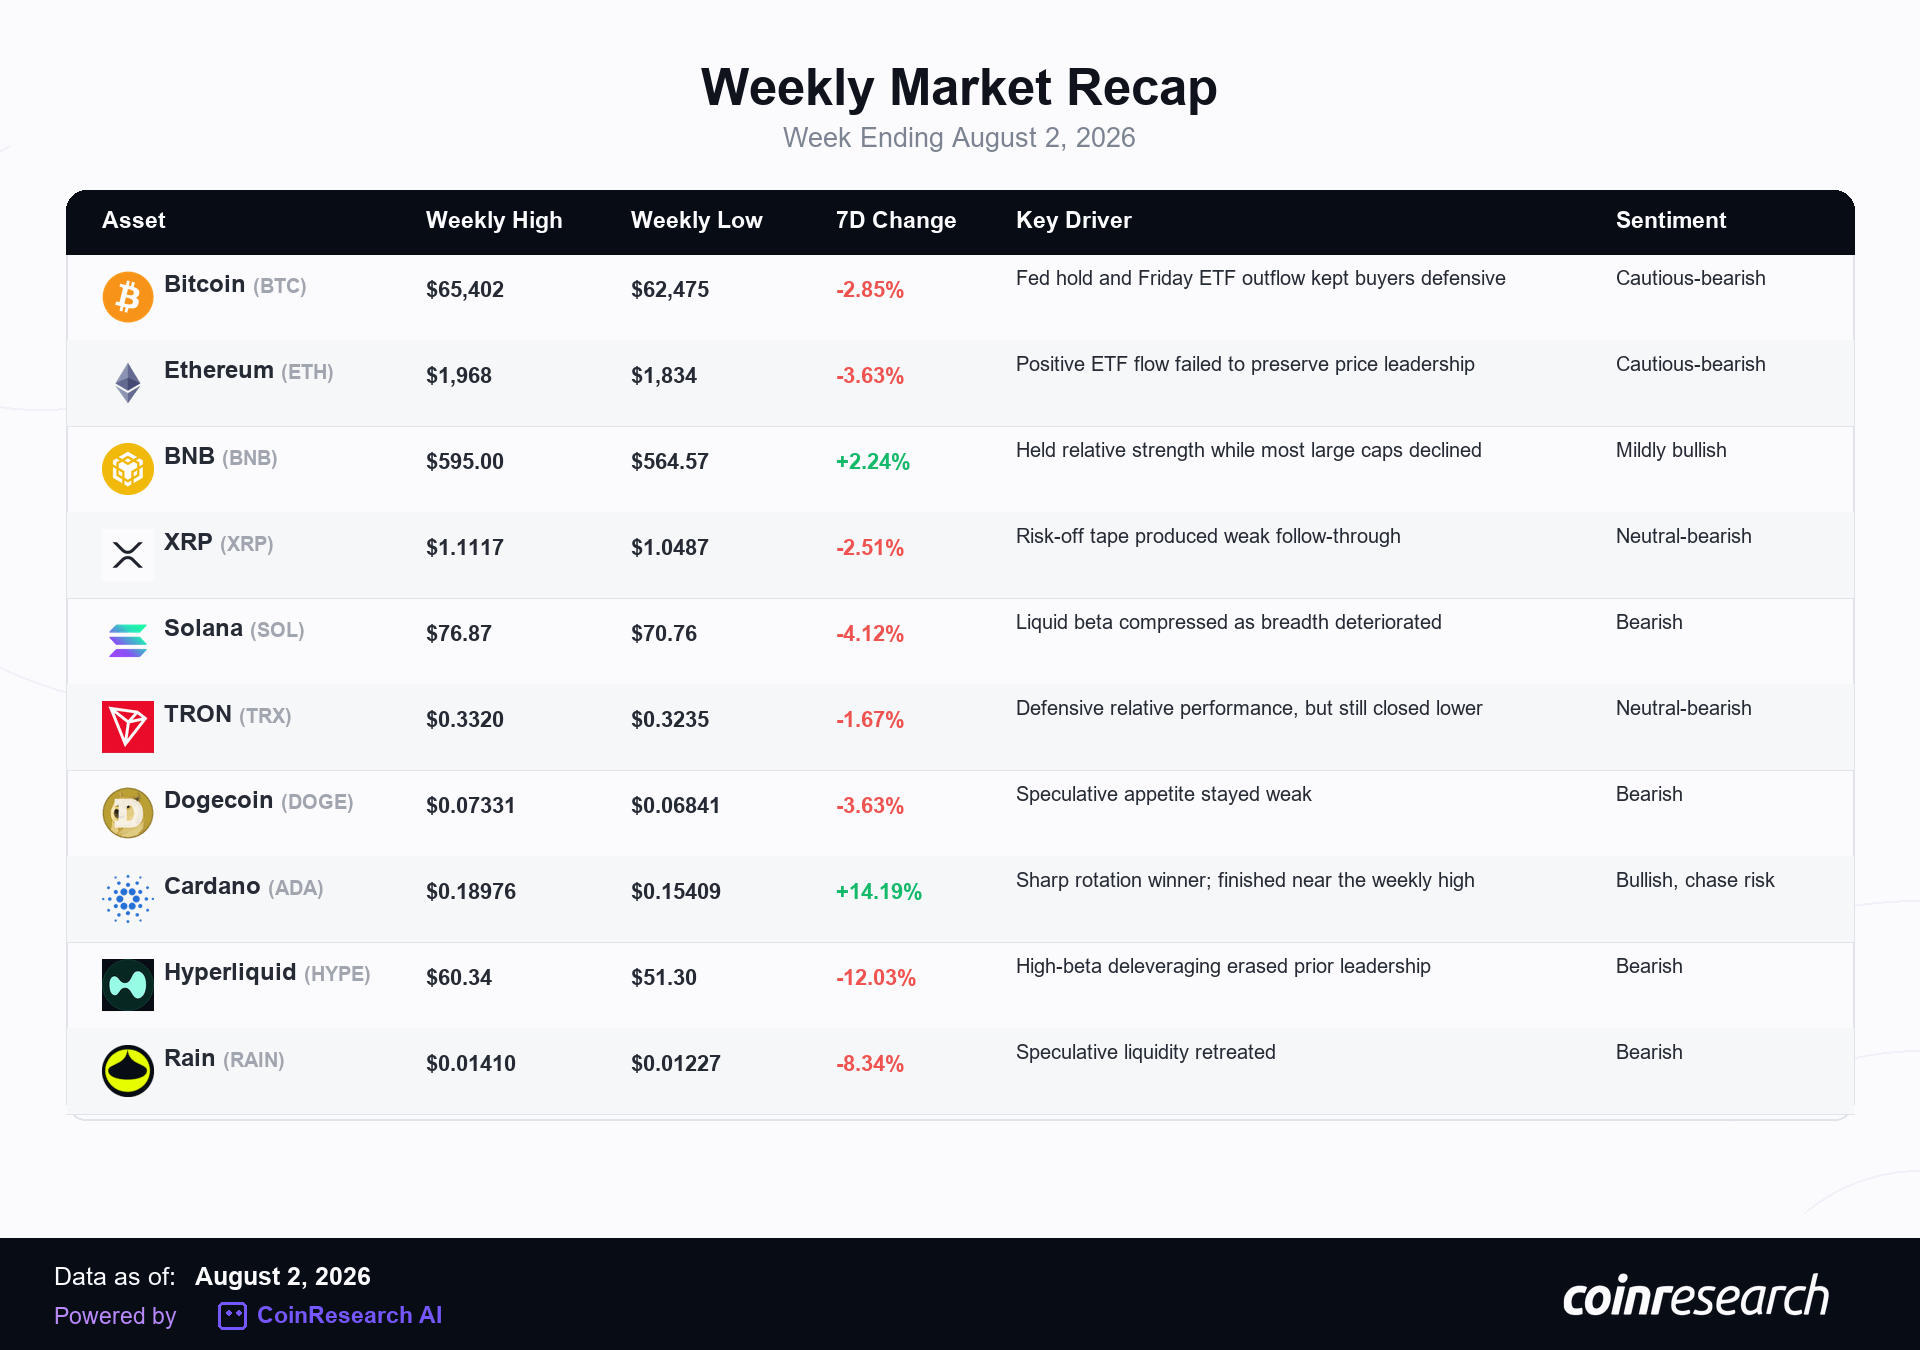
Institutional flows offered little protection. US spot Bitcoin ETFs recorded approximately $61.5 million of net outflow from July 27-31. Ethereum ETFs attracted a modest $10.0 million, but ETH still underperformed BTC. Breadth was equally fractured. ADA gained 14.2% and BNB rose 2.2%, while HYPE fell 12.0% and RAIN declined 8.3%. Fear & Greed ended Sunday at 27 – Fear, after touching 25 during the week. The Fed held rates, but markets did not receive a dovish hold. Until flows, breadth, and sentiment improve together, isolated winners are rotation trades rather than proof of a durable market-wide recovery.
Key themes this week:
-
The Fed held rates, but three hike dissents kept higher-for-longer risk alive.
-
BTC and ETH both declined, while ETH’s modest ETF-flow advantage failed to translate into price leadership.
-
ADA and BNB showed that selective rotation remains possible, but high-beta losses exposed weak breadth.
-
Fear persists without capitulation, leaving the market cautious rather than mechanically oversold.
2. Strengths: What Is Holding
-
Bitcoin absorbed the selloff above its weekly low. BTC traded down to $62,475 and recovered to close almost $1,000 above that level. The market did not finish the week at the point of maximum pressure, which preserves a nearby support reference for the next test. The caveat: BTC still closed below the prior Sunday’s $65,330 level and never reclaimed the $65,402 weekly high. This is stabilization inside a damaged range, not a confirmed reversal.
-
Ethereum ETF demand remained marginally positive. US spot ETH ETFs took in a net $10.0 million over the five sessions from July 27-31, while BTC products lost $61.5 million. The relative flow gap suggests that institutional interest in ETH did not disappear when price weakened. The caveat: ETH fell 3.6%, more than BTC, so the flow was too small to become an effective price floor. Positive demand matters only when it can absorb available supply.
-
ADA and BNB delivered observable relative strength. ADA gained 14.2% from Sunday close to Sunday close, while BNB advanced 2.2% in a week when most large-cap assets declined. That divergence shows capital is still willing to rotate into specific liquid names rather than abandoning the market entirely. The caveat: two winners do not repair broad participation. ADA also finished close to its weekly high, making chase risk more important than the headline return.
3. Weaknesses: What Has Not Been Repaired
-
The two largest assets closed lower together. BTC lost 2.8% and ETH fell 3.6%, reversing the prior week’s relative-strength narrative. ETH’s larger decline is especially important because it occurred alongside positive ETF flows. The market demanded more than a small institutional bid to preserve leadership.
-
The Fed’s hold was not an easing event. The July 29 Federal Reserve statement recorded three dissents in favor of a 25-basis-point increase. The BEA’s Q2 advance estimate placed annualized real GDP growth at 1.5%, while the gross domestic purchases price index rose 5.7%. Slower activity paired with elevated price pressure keeps the cost of capital restrictive and limits the valuation relief available to speculative assets.
-
High-beta leadership broke down. HYPE fell 12.0%, RAIN declined 8.3%, SOL lost 4.1%, and DOGE fell 3.6%. That distribution is consistent with investors reducing liquidity-sensitive exposure even while maintaining selective positions in stronger names. A healthy expansion normally produces broader confirmation from this cohort.
4. Market Recap: Weekly Performance
The weekly board split into three groups. BTC, ETH, XRP, SOL, TRX, and DOGE closed lower, with ETH failing to preserve its prior relative lead. ADA and BNB moved against the tape, while HYPE and RAIN absorbed the sharpest high-beta losses. The result was rotation without breadth: enough selective strength to prevent a uniform risk-off reading, but not enough participation to call the market healthy.
5. Predictive Analytics & Trade Confluence
Disclaimer: The insights and forecasts presented here are generated by CoinResearch AI’s predictive forecast models and supporting analytics. They are provided for informational and educational purposes only and do not constitute financial advice or investment recommendations. Trading digital assets involves risk, and users should conduct their own research, exercise independent judgment, and use appropriate risk management before making any investment or trading decisions.
DOT-USD (Polkadot)
Reference Price: $0.790
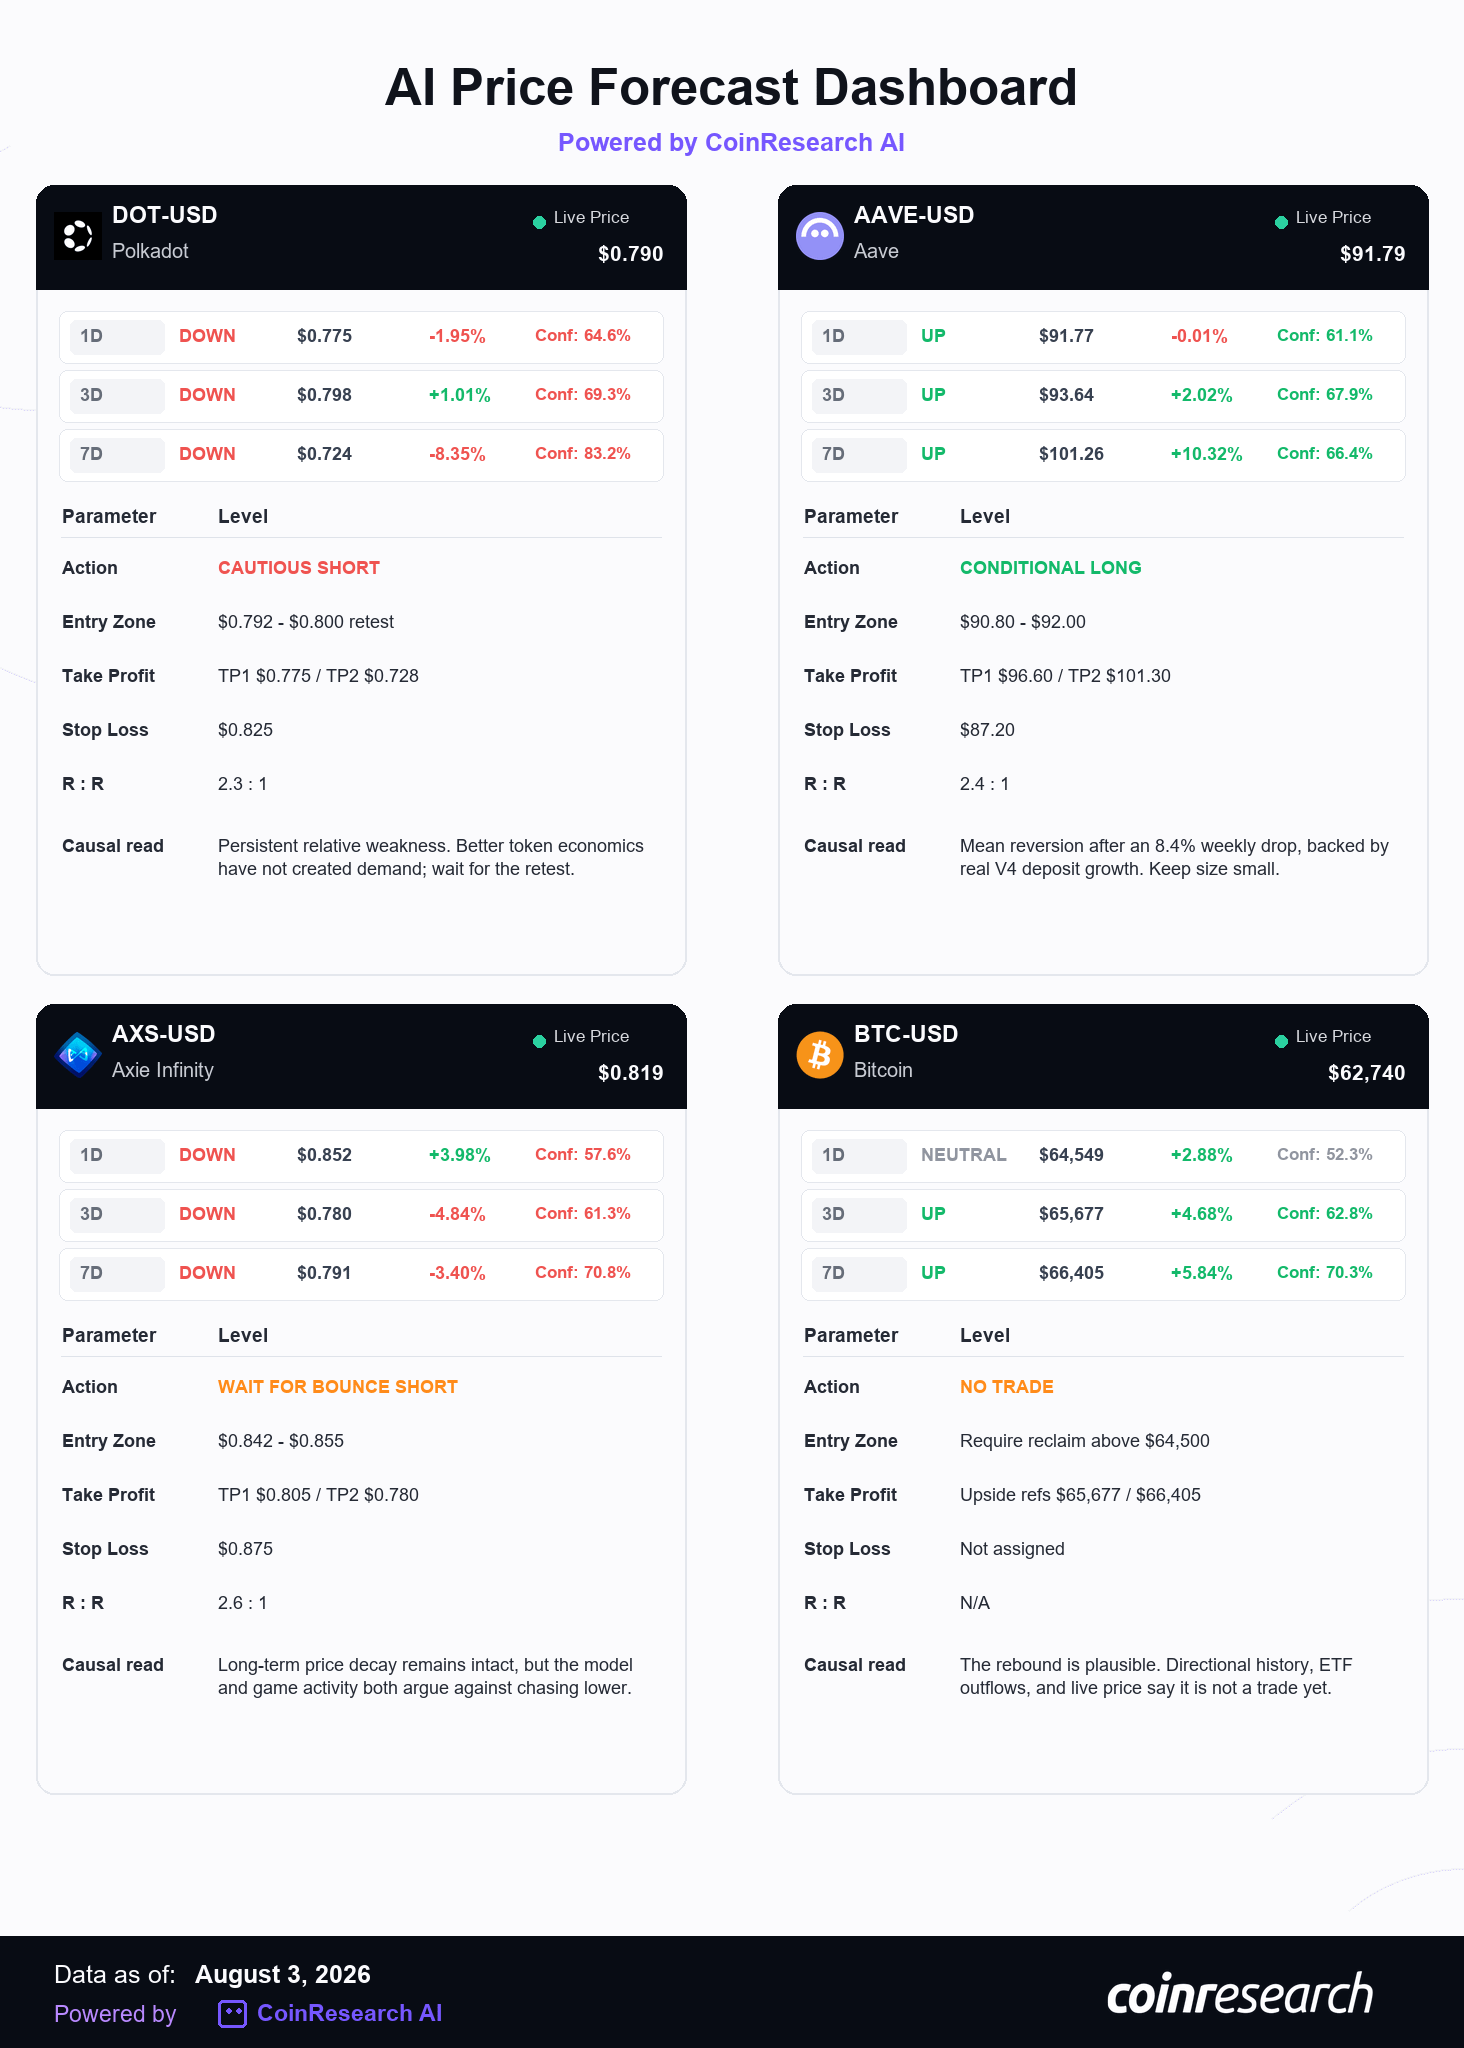
Market Confluence Analysis. The forecast model says DOWN at every horizon. The likely cause is not mysterious. DOT keeps losing relative strength. It was down 3.1% over seven days and 10.5% over 30 days at the live pull. Bitcoin was weak too, but DOT still found a way to do worse. The forecast model is extending that failure to attract demand.
There is a real countercase. Polkadot now has a 2.1 billion DOT hard cap, issuance began stepping down in March, and more than half the supply is staked according to Polkadot’s official economics page. None of it has repaired the chart. That matters more than the brochure. CoinGecko sentiment votes were 61% bullish while price kept sliding, which adds squeeze risk but also shows the market is still carrying hope the tape has not earned. We think the bearish cause survives unless DOT reclaims the top of its short-term volatility band.
Trade Action.
-
Action: Cautious Short on a failed retest.
-
Entry Zone: $0.792-$0.800. Do not chase below the zone.
-
Take Profit: TP1 $0.775; TP2 $0.728.
-
Stop Loss: $0.825.
-
R:R: Approximately 2.3:1 to TP2 from the middle of the entry zone.
-
Rationale: Full directional and forecast model-version agreement, strong seven-day forecast model history, and persistent relative weakness despite better token economics.
-
Invalidation: A sustained close above $0.825 would break the weak-retest structure.
Analyst Note. This is the best card in the run. It is also the third straight week DOT has appeared. That is not a reason to reject it. It is a reason to keep size small and demand the retest.
Verdict: CAUTIOUS SHORT, wait for entry.
AAVE-USD (Aave)
Reference Price: $91.79
Market Confluence Analysis. The forecast model says UP, but it is not calling for an immediate rip. The short-horizon regression is flat while the medium and seven-day structure improves. The likely cause is mean reversion after an 8.4% weekly decline, backed by a protocol that is still growing underneath the token. Aave’s June development update reported V4 deposits above $200 million, a new Paxos Hub, and continued cap expansion. An early-July risk update put deposits near $240 million after another 30% increase. That is live product adoption, not a narrative pasted onto a weak chart. Aave’s June update and the V4 cap review show the mechanism.
The market still looks ugly. Fear & Greed is 28, ETH lost leadership, and AAVE’s one-day directional history is weak. CoinGecko’s sentiment vote showed 100% bullish, but that figure is noisy and probably thin. We treat it as crowding risk, not proof. The long works only as a small mean-reversion position while the current low holds.
Trade Action.
-
Action: Conditional Long, small size.
-
Entry Zone: $90.80-$92.00.
-
Take Profit: TP1 $96.60; TP2 $101.30.
-
Stop Loss: $87.20.
-
R:R: Approximately 2.4:1 to TP2 from the middle of the entry zone.
-
Rationale: Medium-horizon forecast model agreement, a live pullback into the decision zone, and V4 usage growing despite a weak market.
-
Invalidation: A daily close below $87.20, or a decisive BTC loss of $62,475, kills the mean-reversion setup.
Analyst Note. The forecast model probably sees a stretched selloff sitting on top of improving protocol data. We agree, but only with a hard stop.
Verdict: CONDITIONAL LONG, small size.
AXS-USD (Axie Infinity)
Reference Price: $0.819
Market Confluence Analysis. The forecast model says DOWN across all three horizons. Price gives it plenty to work with. AXS was down 8.0% over seven days and 21.3% over 30 days. Gaming beta is weak and the token has not converted product activity into demand. That is probably the causal signal: persistent decay, not a secret feature hidden inside the forecast model.
The short is not ready at market. The one-day regression points to a bounce before the broader decline resumes. Axie’s own July update also reported 2,249 axies bred, up 49% week-on-week, with part evolutions up 40% and ascensions up 21%. Origins Season 18 is distributing rewards through non-transferable bAXS. The ecosystem has activity. The token is failing to capture it. Axie’s official July updates make the bearish price divergence more interesting, but they also make a short at the current low unnecessarily stupid. Let the bounce come first.
Trade Action.
-
Action: Short only after a failed bounce.
-
Entry Zone: $0.842-$0.855.
-
Take Profit: TP1 $0.805; TP2 $0.780.
-
Stop Loss: $0.875.
-
R:R: Approximately 2.6:1 to TP2 from the middle of the entry zone.
-
Rationale: Strong medium- and seven-day bearish history plus long-term price decay, offset by improving game activity and a forecast model-implied short-term bounce.
-
Invalidation: Acceptance above $0.875 would show that the bounce has become a real recovery rather than a failed retest.
Analyst Note. The forecast model’s bearish conclusion is credible. Its timing says not yet.
Verdict: NO MARKET SHORT, sell a failed bounce only.
BTC-USD (Bitcoin)
Reference Price: $62,740
Market Confluence Analysis. The forecast model is neutral for one day and turns UP over the medium horizons. The likely cause is support-based mean reversion. BTC is sitting just above the $62,475 weekly low after a fast macro selloff. forecast models often read that combination as compression followed by a rebound.
We do not trust the call yet. Medium-horizon directional history is roughly 50%-54%, which is not an edge. BTC also fell below the forecast model’s $63,470 snapshot before this article was finished. Last week’s conditional long already stopped. Spot BTC ETFs lost $61.5 million over the week, Fear & Greed sits at 28, and the Fed’s three hike dissents make this a lousy place to pretend support is guaranteed. CoinGecko voters were 67% bullish. Fine. They do not set the clearing price.
Trade Action.
-
Action: No Trade. Reclaim watch only.
-
Entry Zone: None. Require a sustained reclaim above $64,500 before rebuilding a long thesis.
-
Take Profit: TP1 $65,677; TP2 $66,405 only after confirmation.
-
Stop Loss: Not assigned without an entry.
-
R:R: Not assigned.
-
Rationale: The forecast model sees rebound potential, but live price, weak directional history, ETF outflows, and the failed prior support trade do not support another immediate long.
-
Invalidation: A daily close below $62,475 would invalidate the rebound mechanism and expose the lower end of the forecast model’s volatility range.
Analyst Note. A forecast can be plausible and still be useless as a trade. This one needs price to prove it. Verdict: NO TRADE, require $64,500 reclaim.
6. Token Launch & Ecosystem Radar
This week’s radar favors three projects with an identifiable product or distribution path, while keeping token timing separate from promotional momentum. All three remained pre-TGE in the current checks and are absent from the prior-edition tracker.
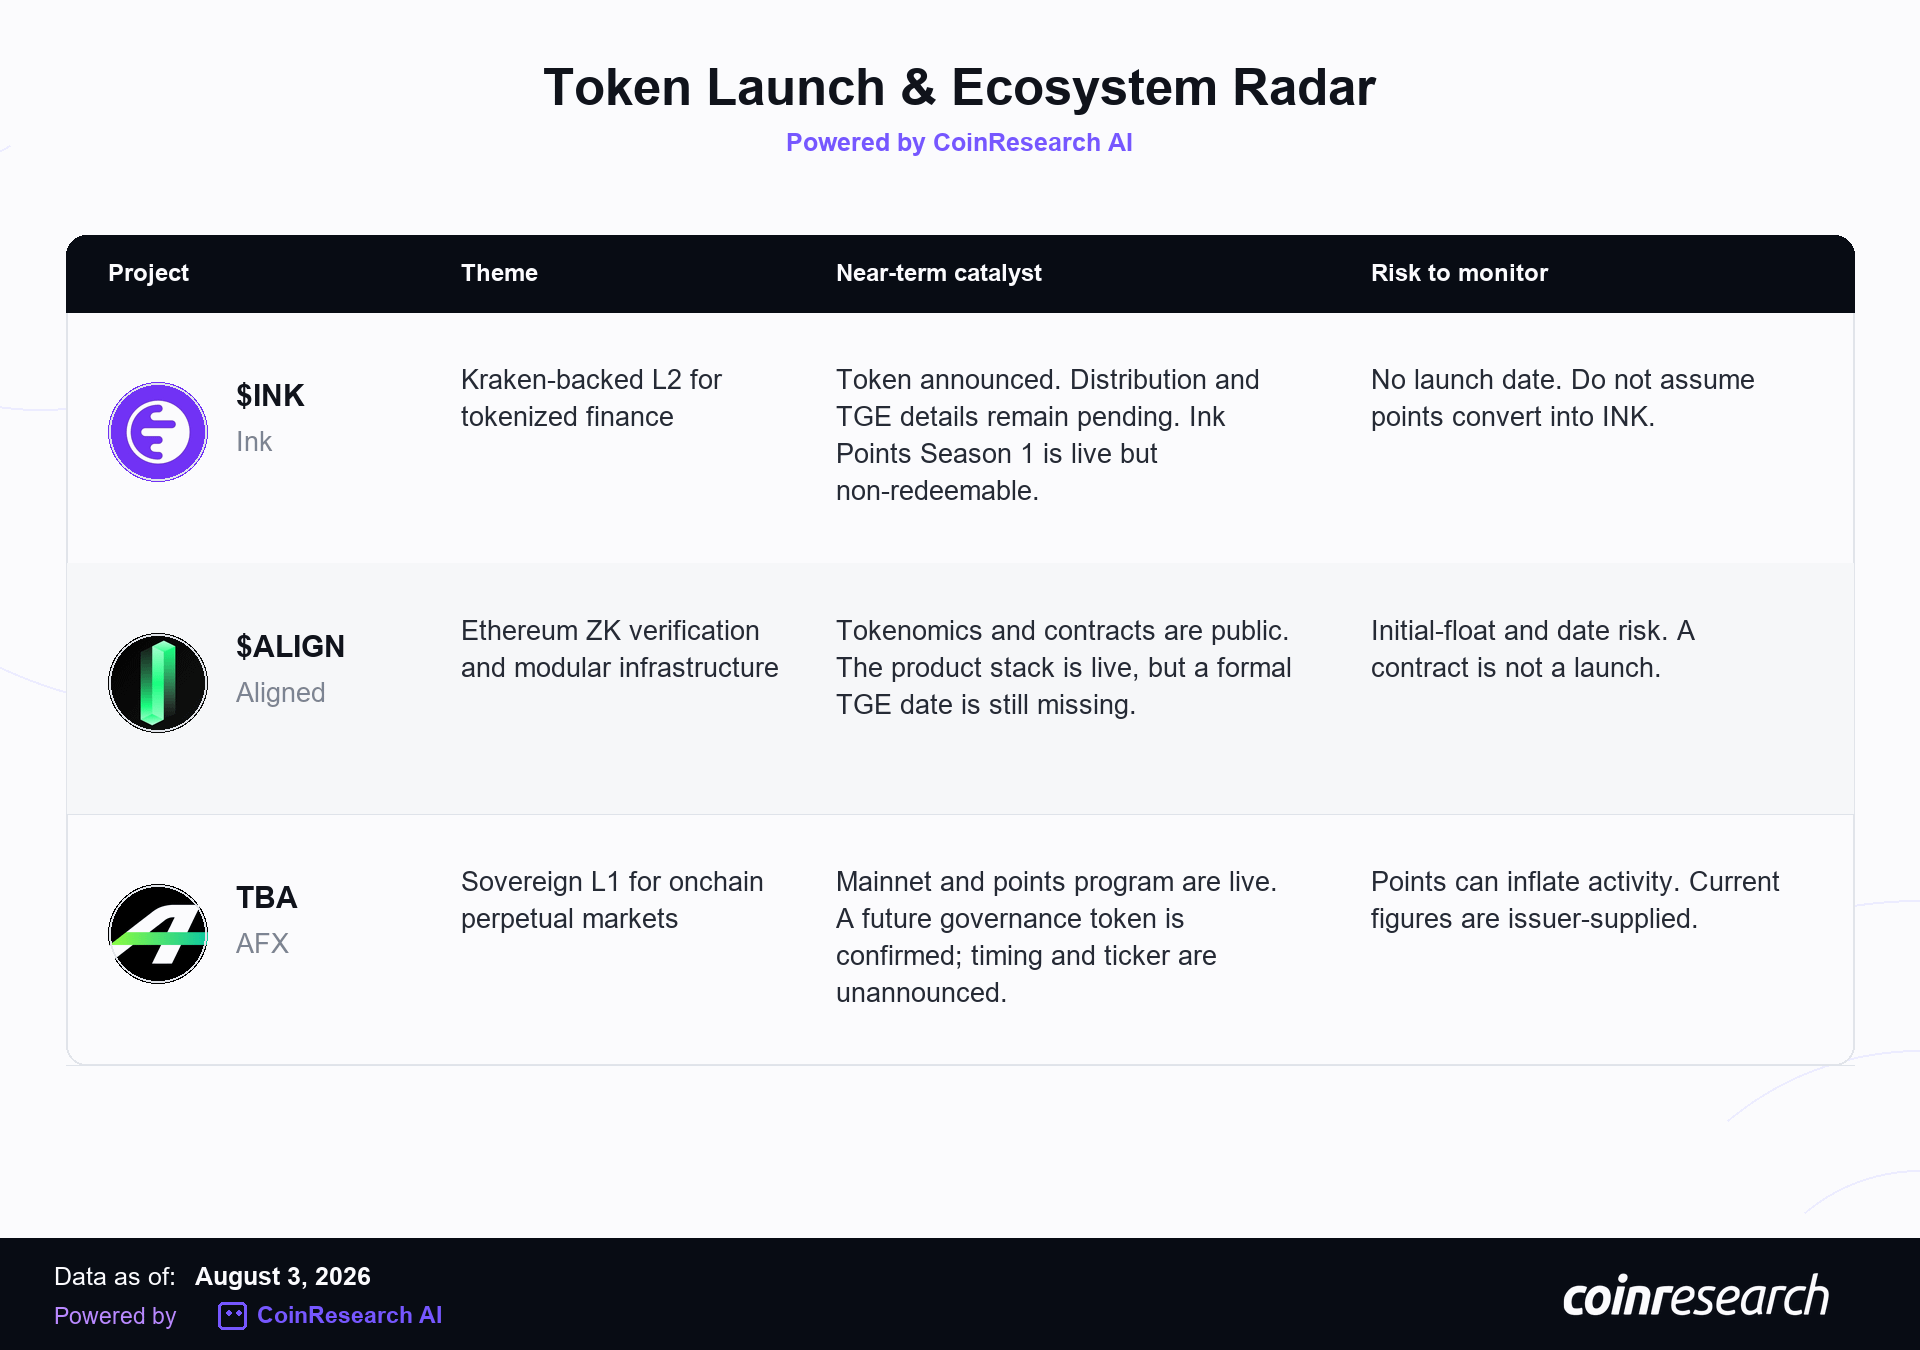
Ink ($INK) – a Kraken-backed Layer 2 positioned around onchain markets, tokenized finance, and distribution through the Kraken ecosystem.
-
Why watch it: Kraken has announced the INK token and a future distribution program tied to active Kraken clients and the Ink ecosystem. That gives Ink a credible distribution channel before launch rather than relying exclusively on an anonymous points campaign.
-
Current Status: Pre-TGE. No official launch date was found, and CoinGecko lists INK as preview-only and unavailable to trade. Ink Points Season 1 is active, but the points are explicitly non-tokenized, non-redeemable, and have no cash value. They must not be treated as guaranteed token allocation.
-
Monitoring Rationale: Watch for formal distribution terms, launch timing, circulating supply, and evidence that activity persists without speculative assumptions about points conversion. Kraken’s INK announcement establishes intent, but execution details still determine the investment case.
Aligned ($ALIGN) – Ethereum infrastructure for zero-knowledge proof verification, aggregation, wallets, and modular rollup deployment.
-
Why watch it: Aligned links its token thesis to an operating technical stack rather than a token-first narrative. The project has published tokenomics and continues to develop proof-verification and aggregation products that can be monitored before launch.
-
Current Status: Pre-TGE. The official tokenomics update describes a 10 billion ALIGN supply and approximately 16% initial circulation, with no team or investor tokens unlocking until one year after TGE. No official launch date was found, and CoinGecko still marks ALIGN as unavailable to trade.
-
Monitoring Rationale: Track the formal TGE announcement, final circulating-supply composition, mainnet usage, and whether demand for proof verification develops independently of token incentives. A published contract and tokenomics document establish preparation, not a completed launch.
AFX (Ticker TBA) – a sovereign Layer 1 designed as an execution environment for decentralized perpetual markets.
-
Why watch it: AFX has launched its mainnet and targets onchain BTC, ETH, gold, and crude-oil perpetuals with native FIX connectivity. Its three-season points program is intended to connect current trading and liquidity activity to a future governance-token launch.
-
Current Status: Pre-TGE. A future token is described in the project’s points announcement, but the ticker and launch date remain unannounced. The mainnet announcement and points details are issuer-supplied press material, so the underlying activity must be verified independently.
-
Monitoring Rationale: Measure mainnet trading volume, repeat-user activity, liquidity retention, and the final token terms. Points-driven participation can overstate organic demand, making post-incentive usage more important than enrollment totals.
7. Strategic Recap & Forward Outlook
The market did not receive the clean policy relief that a rate hold might imply at first glance. BTC and ETH both retreated, ETF support was inconsistent, and high-beta assets weakened. At the same time, ADA and BNB showed that capital has not abandoned crypto altogether. The useful distinction is between selective rotation and broad risk appetite. The former is present; the latter is not yet confirmed.
Edition #37 also reinforced the need for bounded conviction. DOT’s relative weakness translated into a first-target hit, while BTC’s conditional support trade failed. The next forecast model slate should therefore be judged by more than directional agreement. It must explain why the forecast model is seeing the move, whether that cause remains active in the real market, and whether the live entry still compensates for the risk.
Forward Outlook – Week of August 3-9, 2026
-
Macro Watch. The week begins with July ISM Manufacturing on August 3, followed by June JOLTS on August 4, July ISM Services on August 5, preliminary Q2 Productivity and Costs on August 6, and the July Employment Situation on August 7. The dates are confirmed by the BLS release calendar and ISM report calendar. The central question is whether labor and services data reinforce the Fed’s inflation caution or reopen a credible path toward easing. The ISM Manufacturing release occurs after this draft’s preparation and must be refreshed before publication.
-
BTC Key Levels. The immediate support reference is the $62,475 weekly low. The recovery band sits near $65,330-$65,400, spanning the prior Sunday close and the latest weekly high. A sustained break below support would extend the Fed-week decline. A reclaim of resistance would improve the structure, but it would still need stronger ETF follow-through and broader participation to become a durable risk-on signal.
-
Altcoin Outlook. ADA’s surge and BNB’s positive close prove that selective relative-strength trades remain available. They do not establish an altseason while ETH underperforms BTC and liquid high-beta names are being sold. The correct posture is to verify liquidity, catalyst durability, and entry discipline asset by asset rather than extrapolating one-week outliers into a portfolio-wide call.
For full prediction dashboards, trade setups, and live forecast model signals, visit
Disclaimer: CoinResearch Intelligence Weekly is published for educational and informational purposes only. Nothing in this newsletter constitutes financial advice. Cryptocurrency markets are highly volatile – past performance does not guarantee future results. Always conduct your own research and consult a qualified financial adviser before making investment decisions.